Reports - forecast vs target

Hello,

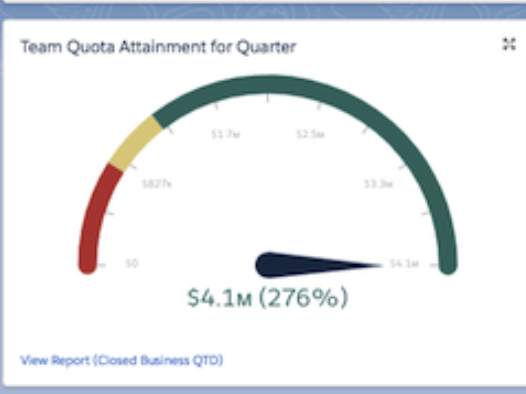
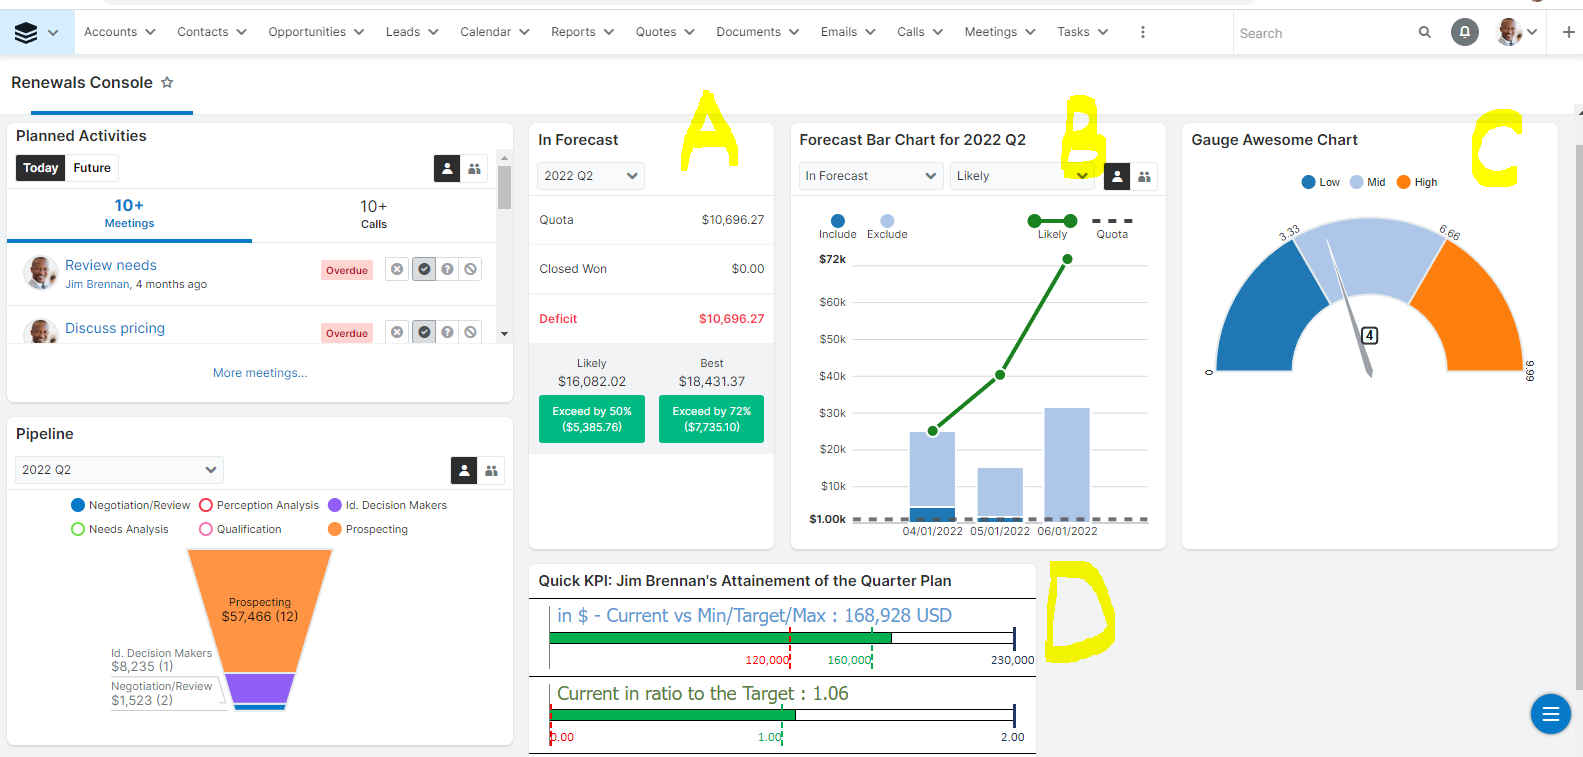
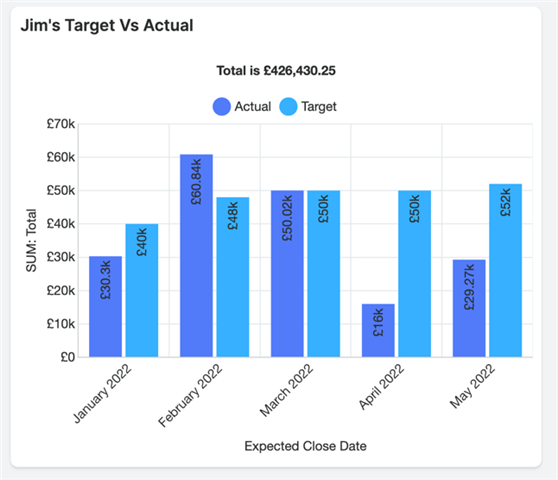
Do you know is it possible to set up targets for dashboards in SugarCRM - e.g. target for Month A is 10,000 USD revenue and the dashlet will show how far we are to reach the target? 

I am looking to set up individual targets as well as group sales targets.

Thank you!

  • Hey Ada, 

    This question might be better asked with the Sell folks, but I'll try my shot at it.

    Without knowing how, exactly, you have the Forecasts module set up, I wonder if you're aware that in the Forecasts module, someone that has users that report to them may see their reportees forecasts at the user level. You may learn more here:

    https://support.sugarcrm.com/Documentation/Sugar_Versions/12.0/Sell/Application_Guide/Forecasts/index.html#Management_Hierarchy

    This is, however, using the Forecasts which can only be set up Quarterly or Yearly ( https://support.sugarcrm.com/Documentation/Sugar_Versions/12.0/Sell/Administration_Guide/Forecast/ ) So it's not on a monthly basis, but at best, a 3-month basis. Still, this might help you better understand where reportees are at on a user level.

    The two forecast dashlets do not have user-level statistics. You can see the details on those dashlets here:

    https://support.sugarcrm.com/Documentation/Sugar_Versions/12.0/Sell/Application_Guide/Forecasts/index.html#In_Forecast_Dashlet 
    https://support.sugarcrm.com/Documentation/Sugar_Versions/12.0/Sell/Application_Guide/Forecasts/index.html#Forecast_Bar_Chart_Dashlet

    It may make more sense to create a Summation or Summation with details reports on Opportunities or RLIs expected to close in a specific month, and then add the report's chart to a Dashlet. 

    We have some stock reports that may be close to what you are looking for. You can copy these stock reports and modify them to suit your needs, or use them as-is if they work for you:

    Pipeline by User (Revenue Line Items)
    Quotes Created by Users by Month
    Open Quotes by Stage by Close Month
    Open Opportunities by User by Expected Close Month

    You may see more stock reports here:

    https://support.sugarcrm.com/Documentation/Sugar_Versions/12.0/Sell/Application_Guide/Reports/Stock_Reports/

    Hopefully, this at least helps you get closer to what you are looking for. If you have more specific information, please let me know! I'm happy to help however I can. 

    -Raye

  • Hi Raye, 

    That's very useful, thank you. We still need to set up Forecast unfortunately, so I am looking for a interim solution.

    I was thinking about a graph type that you set up one goal for yourself or team and the sum of e.g. ARR appears there against the goal - similar to what Salesforce graph has.

    Is something like that possible to add in Sugar?

    Thank you!

    Ada

  • - Per 's comment ("This question might be better asked with the Sell folks, but I'll try my shot at it.") I moved this over to our Enterprise & Sell group from Sugar Serve to better help you with your reporting questions!

  • Hi 

    I've tried to mark 4 dashlets on the screenshot of my Sugar demo instance with yellow letters  A, B, C, and D

    A and B  are out-of-the-box dashlets that visualize Forecast fulfillment  - they could be of great use in case the out-of-the-box Sugar Forecast  functionality outfits your company expectations

    C is a visualization of gauge chart (that's the type of the chart on your screenshot) should be available as a Sugar visual asset, however, the one on the scene is just visualization - delivery of the background logic is a custom work that could be performed by Sugar Prof Services or Sugar Partner teams (like ours) - literally with code development that require programmers efforts

    D is a Quick KPI functionality dashlet that allows setting configurable Report-based criteria for visualizing min/current/target/max values on the dashlet - as Sugar Partner we delivered that enhancement  for one of our customers

    Nevertheless, I'm very interested to know what Sell folks or other consultants would advise on your inquiry to have KPI  visualized on the dashboard  - please share here on a chance

    Best Regards,
    Dmytro Chupylka

    integroscrm.com
    We make work in Sugar CRM system faster, more convenient and efficient

  • Hi Ada, 
    Sometimes what we'll do in some of our customer systems where a bespoke KPI or Target must be reached is create a new dropdown field in the module that needs to be evaluated for targets (values: Actual + Target). Set the default value to "Actual".

    Then we'll create some records where this filed = Target. These records will be users monthly targets, let's. say.

    Then I'll create a summation report and group the results by the user and then by this new field.

    The result is a grouped bar chart where each bar is a user, segmented by their target vs actual.

    Using this method, it means that we're able to create targets in any module in Sugar. The only downside is that there could be quite a lot of 'tagret' records to import, depending on how you want to evaluate some users targets.

    Thanks, James - SUGABYTE

  • Target is an objective amount of money and/or quantity - a total - per User/Team and/or Product type depending on the planning model company uses

    For KPIs the Target is to be compared with current sales results calculated on the basis of sales data - Opps won, Quotes closed or whatever is used to manage sales and differentiate ongoing sales from the ones that has fulfilled the target

    So Targets and Current sales results are not physically related with relationship and shouldn't be related forcefully due to their different nature: Targets are aggregates (target valued) and sales are detail data (Opps, Quotes, etc) - they are compared visually in a friendly readable diagram

    At the same time, Sugar regular Reporting engine allows to build reports on some module (e.g. Opps, Quotes, etc) and filter on that module fields along with related to that module data only - it means that non-correlated data like Targets and Opps couldn't be added into the same report simultaneously and visualized with report chart

    Am I missing something?

    Best Regards,
    Dmytro Chupylka

    integroscrm.com
    We make work in Sugar CRM system faster, more convenient and efficient

  • Hi Dmytro, I'm not sure if you're missing something.

    If you have opportunities where type = Target, you can 'simulate' target data and report on the Count, or the value.

    For example, if you import 12 x opportunities where type = Target, assigned to Jim where each record for each month has a value of £10,000. Each of the 12 records would have an expected close date of

    01.01.2022
    01.02.2022
    01.02.2022
    ....and so on...

    If you then build a summation report,
    Filter = Jim's Opps
    group by  = Month Exp Clode date, then "Target vs Actual" field

    The end result will be a bar chart, with 24 bars (2 per month, grouped in that month) where one bar show's his Target for that month, and the other shows his 'actual'.


    As I said before, if you ensure that this new field: "Target vs Actual" defaults to "Actual", then each opp that a person created will be "Actual". The only "Targets" are imported (almost like simulated data).

    This does mean that all other reporting in that module needs to filter out the target records.

    It's just a primitive way of introducing Targets with no code development. Just a new field and some imports.

  • Hi James - thank you for details - so if I get it right the idea is to put both sales and targets into the same module of e.g.Ops and differentiate them by type for getting two seria of data - target and actual - from the single source and therefore allow Reports to display them in a chart.

    I wonder whether putting two really different business objects - Targets and Sales -  into the same module of Opps is OK architecturally due to the risks that mixing two business objects  may/will bring to the business model that CRM automates.

    However that is really beneficial how Sugar flexibility allows to apply workarounds, and I'd agree that implemening the idea may bring a quick relef in/for a short term

    Best Regards,
    Dmytro Chupylka

    integroscrm.com
    We make work in Sugar CRM system faster, more convenient and efficient

  • Hi Dmytro, no worries.

    Yeah it's just an easy way of inserting the logic of Targets into any module in Sugar. The only downside, is (depending on how complex your targets are) it may involve importing quite a lot of data.

    But it works for some!

    The better way (and more expensive) would be a proper target module where target records auto-linked via a logic hook. And perhaps some custom dashlets that monitor live performance. But this could require heavy development.

  • Oh, I can configure logic hooks with Logic Builder very fast, so I believe the solution could be serial!

    What about implementing the idea of the proper Target module and logic hooks right now?

    On success, we could hold a joint webinar demoing solution based on Sugar platform

    I've arranged a demo instance https://sg-example08.demo.sugarcrm.eu/ (admin/asdf), so we could add the necessary custom Target module in Studio
    Let me know what are the requirements for logic hooks, and what records they should link?

    I wonder also if we can set up a model in such a way so that live performance tracking could be achieved with Reports charts instead of heavy development of custom dashlets?

    Best Regards,
    Dmytro Chupylka

    integroscrm.com
    We make work in Sugar CRM system faster, more convenient and efficient