
I'm trying to do a custom dash-let with a chart, I installed the package and when I add it to the dashlet in a Dashboard before it was saved in preview the charts looks great but when I save it, it doesn't work anymore and it shows this error
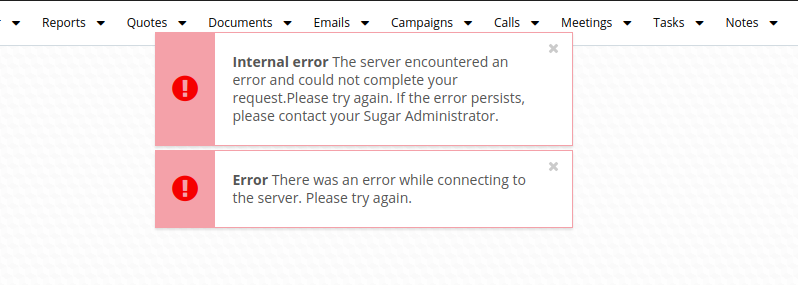
after I can't access any record from that module (Accounts)
by the way the chart its feed with the endpoint information.
my code is the following:
Controller:
/**
* @class View.Views.Base.AgentPointsChartView
* @alias SUGAR.App.view.views.BaseAgentPointsChartView
* @extends View.View
*/
({
plugins: ['Dashlet', 'Chart'],
className: 'sales-chart',
chartData: {},
total: 0,initialize: function (options) {
this._super('initialize', [options]);this.chart = nv.models.multiBarChart()
.x(function (d) { return d.x })
.y(function (d) { return d.y })
.tooltips(true)
.showValues("end")
.vertical(false)
.stacked(false)
.strings({
noData: app.lang.get('LBL_CHART_NO_DATA')
})
.showTitle(true);
},loadData: function (options) {
if (this.meta.config) {
return;
}
let id = this.model.id;
let url = app.api.buildURL('Accounts/chart/' + id);options = {
success: _.bind(function(data) {
this.evaluateResult(data);
}.bind(this)),
complete: options ? options.complete : null
};app.api.call('read', url, null, options, {context: this});
},evaluateResult: function (data) {
this.chartData = data;
this.total = 1;
this.renderChart();
},
renderChart: function () {
if (!this.isChartReady()) {
return;
}d3.select(this.el).select('svg#' + this.cid)
.datum(this.chartData)
.call(this.chart);this.chart_loaded = _.isFunction(this.chart.update);
this.displayNoData(!this.chart_loaded);
},})
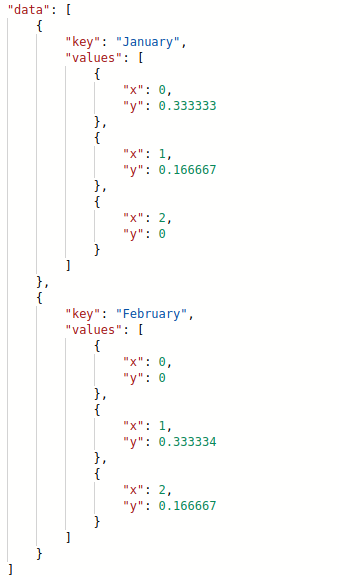
This is an example of endpoint response:
Thanks for helping.