

Author: Yuri Gee
Date: 01 Sep 2025
10 minute read time
In Part 2, we expand on the data chart presented in Part 1 to illustrate how—and which—database tables grow or shrink, measured in both absolute values and percentage change. To visualize these metrics, we’ll use stacked vertical bar charts within summation and matrix reports.
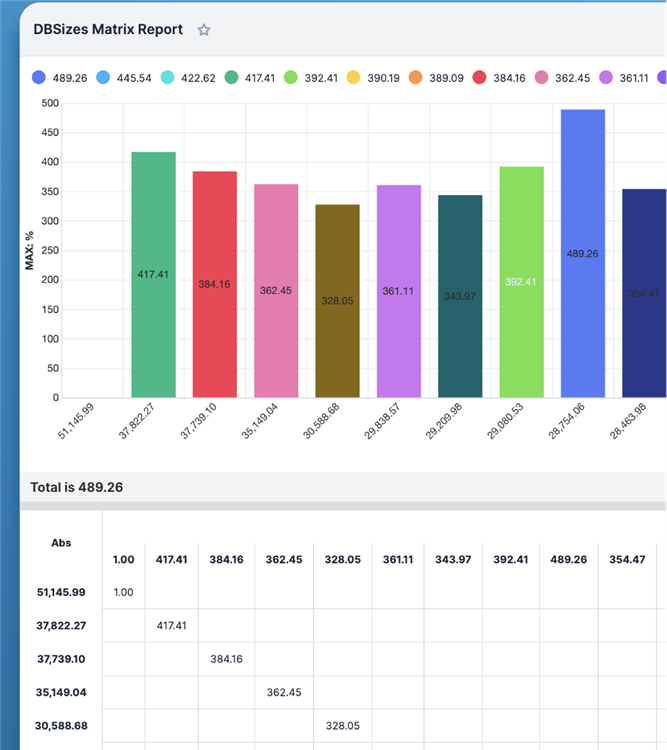
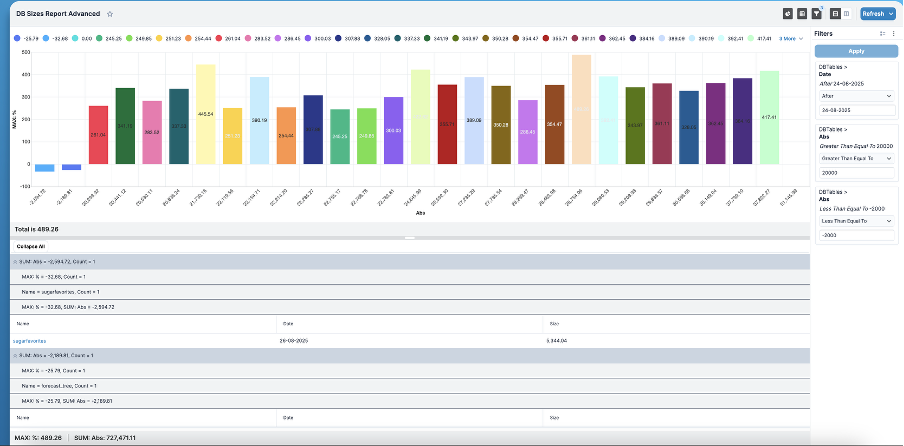
In the matrix chart example below, the x-axis displays tables sorted by decreasing absolute size, starting from highest value on the left. The y-axis reflects percentage growth relative to the earliest available measurement date.
For newly created tables, a static growth value of 1% is assigned to help differentiate them from existing ones, while still allowing users to access table names and details via drill-down drawers.
Creating formulas for Absolute and % Growth
We’ll continue using the DBTables module introduced in the previous article, now enhanced with two additional float fields—growth_abs (Abs) and growth_pcnt (%)—each configured with two-digit precision. We also create a circular one-to-many relationship—tb_dbtables_tb_dbtables—between the DBTables module and itself.
The created fields are designed to calculate growth by referencing the related record with the earliest measurement_date, extracting its corresponding table_size.
For the growth_abs field, we apply the custom getConditional formula developed earlier. However, built-in formulas like rollupConditionalMinDate and rollupConditionalSum, with proper date formatting, can also be considered as alternatives for achieving similar results:
subtract($table_size,ifElse(greaterThan(count($tb_dbtables_tb_dbtables),1),number(getConditional($tb_dbtables_tb_dbtables,"!name",createList(createList("name","")),"table_size",createList(createList("sortup","measurement_date"),createList("limit","1"),createList("sum")))),0))
The formula for percentage growth assigns a default value of 1% to newly created tables, serving as a placeholder to distinguish them from existing ones. For subsequent measurements of existing tables, the percentage reflects the actual change in table size compared to the earliest recorded value:
ifElse(greaterThan(count($tb_dbtables_tb_dbtables),1),subtract(divide(multiply($table_size,100), number(getConditional($tb_dbtables_tb_dbtables,"!name",createList(createList("name","")),"table_size",createList(createList("sortup","measurement_date"),createList("limit","1"),createList("sum"))))),100),1)
Both absolute and relative growth values can be either negative or positive. To prevent potential issues—such as division by zero errors or performance inefficiencies—it's recommended to import only records with a table_size greater than zero into the DBTables module. This is why the custom query used in the previous article was designed to return only rows with non-zero table sizes.
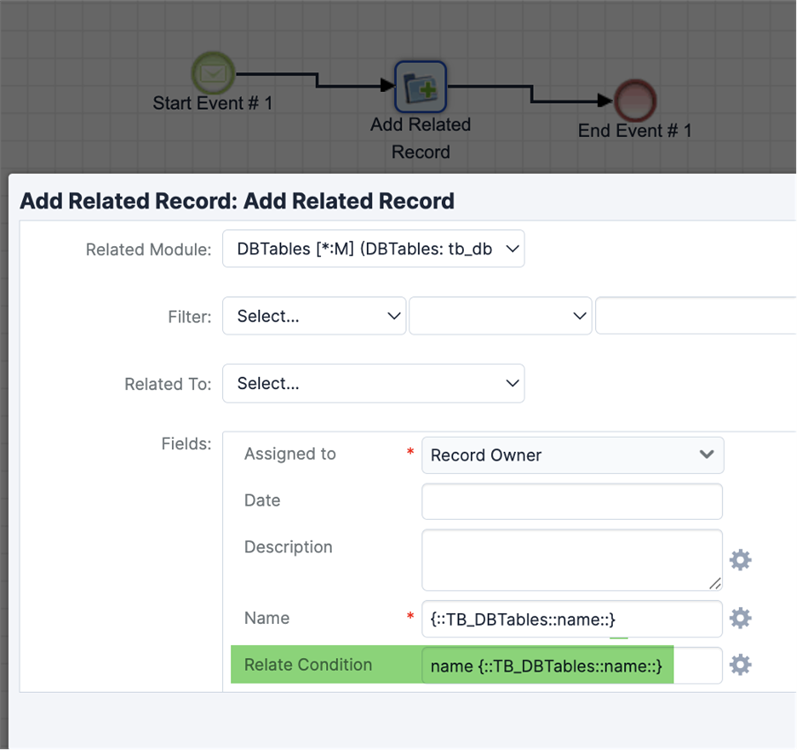
Establishing Measurement Relationships via BPM Workflow
In this section, we’ll apply the method outlined earlier to configure a BPM that links measurement records belonging to the same database table.
To start, we create a supporting text field called relate__condition_c. Next, we design a BPM that automatically assigns related records to the correct side of the relationship (:M) whenever a new table entry is imported. This linkage is based on the shared table name across records, ensuring that all measurements for a given table are properly related.
By default, the BPM extension associates up to 10 records at a time, though this limit can be increased. Additionally, older measurements used as reference points for charting can be removed, and them making recalculation of formula values to establish the next available reference point.
Alternative methods for importing and linking records include using REST API collections to establish relationships programmatically, or setting up a scheduler to automate both the import process and the linking of related entries.
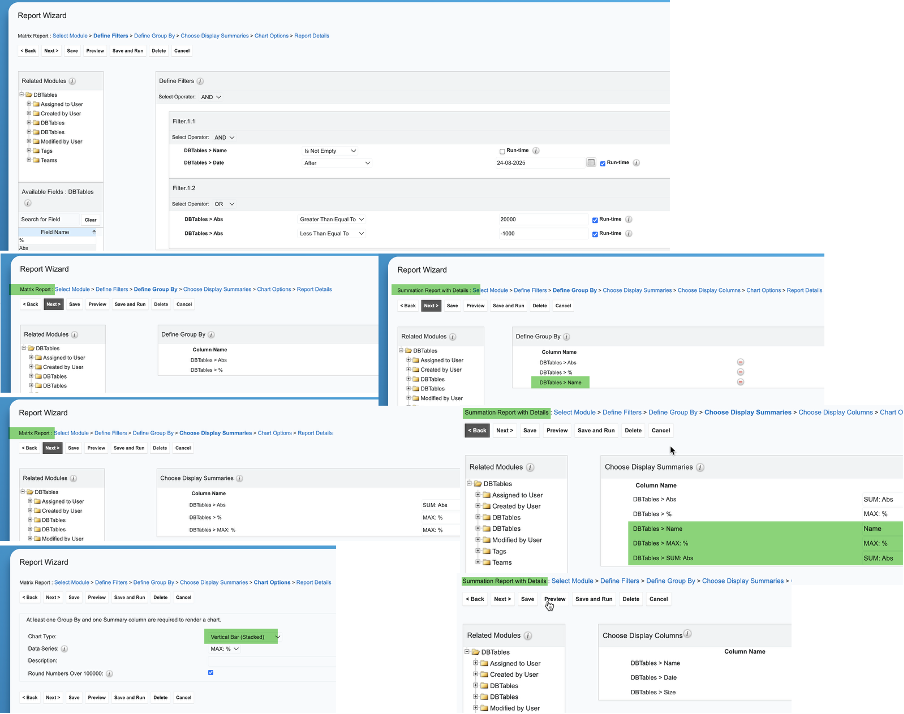
Building and Running the Reports
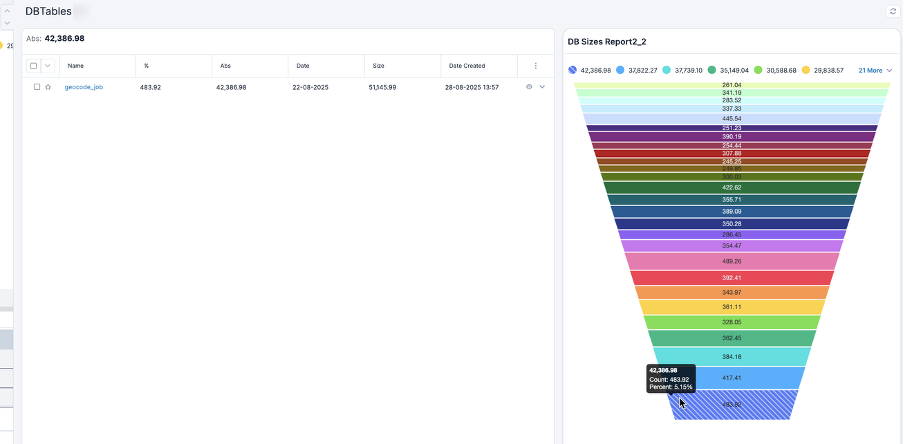
You can then create a summation report and/or matrix report, along with other chart types—such as horizontal bars, funnels, pies, or line charts—depending on the grouping criteria used. These visualizations will help display both absolute and relative growth metrics clearly.
The summation report can include key values like maximum percentage growth and total absolute growth, while the matrix report may highlight maximum percentage changes across grouped data. The total sum is especially useful for assessing overall database size changes and identifying cases where certain tables may have been excluded or removed in the subsequent queries.
To maintain accuracy, apply runtime filters that restrict the report to the most recent measurement date and ensures displayed thresholds for absolute and percentage growth highlight the most significant changes—whether those values were calculated during import or recalculated using the earliest available reference point.
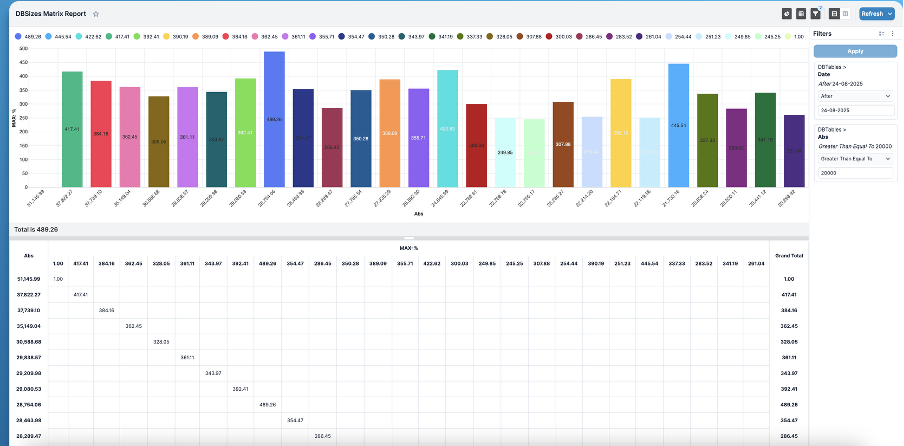
Example Report Visualizations
Matrix report displaying database tables sorted left to right by decreasing absolute size change, with each entry showing either a reduction greater than 2MB or a increase above 20MB (as an example)—typically ranging from several hundred MB to multiple GB in production environments.
A summation report displays absolute growth along the x-axis, increasing from left to right, while relative growth is plotted on the y-axis. The first two entries reflect a decrease in table size (negative growth), and the final entry represents a newly added table with a static growth factor of 1%.
By analyzing the chart across both axes and applying real-time filters, users can quickly pinpoint tables that require attention—whether due to rapid expansion or significant increases in size.
The visualization can be switched to Funnel, Pie, or Line charts—though Line charts may require additional axis adjustments. Regardless of the chart type, selecting a data point will still open the corresponding table name in the drawer for easy reference.
Additional Notes
In this article, we explored a more advanced approach to visualizing database table sizes, focusing on the dynamics of both absolute changes and percentage growth over time across multiple measurement dates. These insights can be further refined by filtering based on the magnitude of absolute or relative change.
Building on the foundation laid in the previous articles, this scenario supports proactive storage management and cleanup of unused or temporary data through standard Data Archiver tools—helping ensure sustained database performance. As always, we welcome and value your feedback.