

Author: Yuri Gee
Date: 20 Aug 2025
5 minute read time
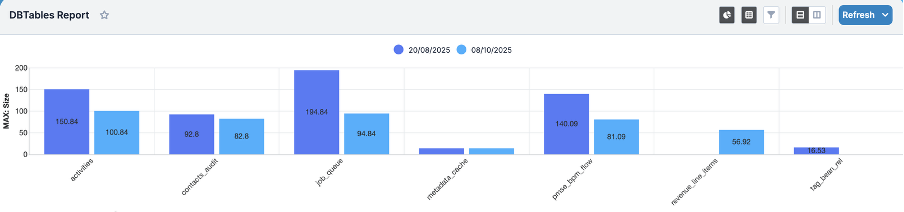
In this article, we’ll apply a previously introduced technique to visualize variations in SugarCRM database table sizes using standard out-of-the-box reports. The resulting chart helps identify tables whose sizes are growing more rapidly, enabling administrators to configure schedulers for periodic cleanup of unnecessary or temporary data—greatly simplifying instance management.
The chart below illustrates how this method displays table sizes filtered by the report (e.g., those larger than 5MB). In production environments, sizes are typically measured in gigabytes. The example showcases variations across two recent measurement dates, though additional data points can be added for a more comprehensive view.
Implementation Details
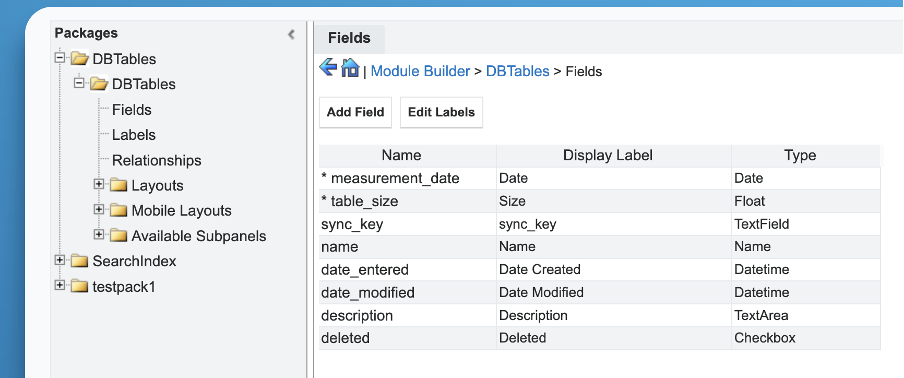
We'll create a custom module using Module Builder that includes the following fields:
name – for storing the table name
table_size – a Float field with two-digit precision, representing the size including indexes (measured in MB for test environments and GB in production)
measurement_date – a Date field to capture when the size was recorded
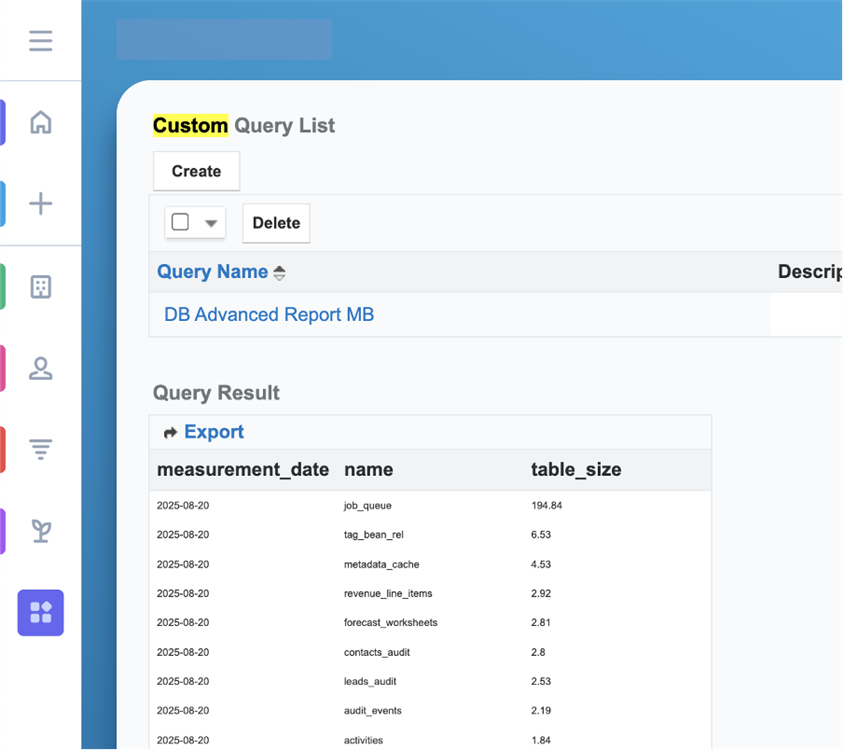
Next, we'll create a Custom Query (or use an Advanced Report) based on the following SQL statement to display table sizes in megabytes (MB):
select curdate() as measurement_date, table_name as name, round((data_length + index_length) / pow(1024, 2), 2) as table_size from information_schema.tables where round((data_length + index_length) / pow(1024, 2), 2) <> 0 order by (data_length + index_length) desc;
and gigabytes (GB):
select curdate() as measurement_date, table_name as name, round((data_length + index_length) / pow(1024, 3), 2) as table_size from information_schema.tables where round((data_length + index_length) / pow(1024, 3), 2) <> 0 order by (data_length + index_length) desc;
The output of the query is shown in the following picture.
Finally, data from the Advanced Reports will be periodically imported into the Custom DBTables module created in the first step —typically on a weekly basis, with around 300 records per date. As a result, the module will hold the relevant entries needed for visualizing the chart.
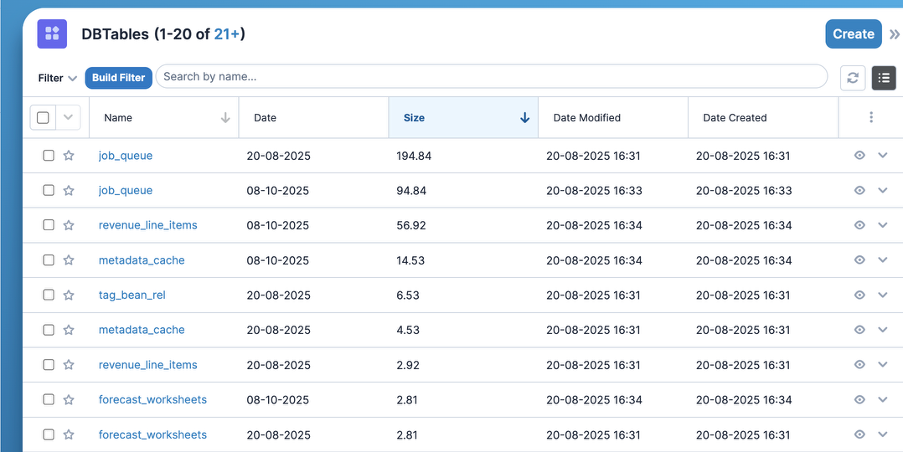
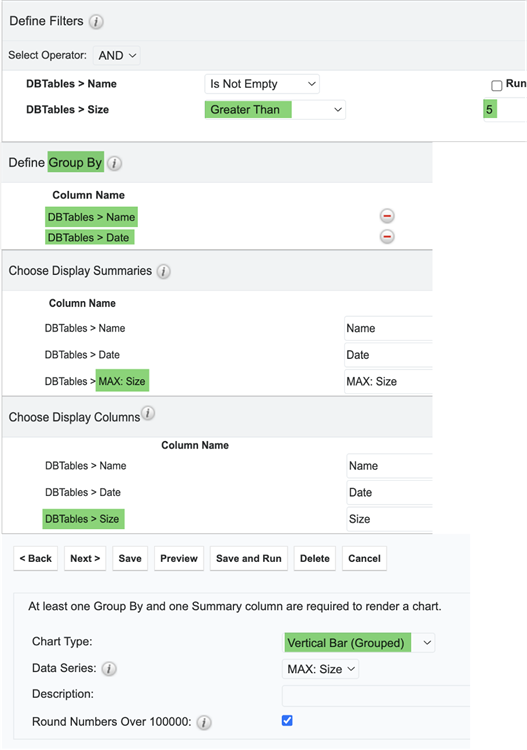
Building and Running the Report
A summation report with details can be created using the following criteria within the DBTables module to showcase variations in the largest database table sizes across a defined time range.
Additional Thoughts
In this article, we explored a practical approach for analyzing variations in SugarCRM database table sizes using out-of-the-box techniques. If the chart becomes too cluttered due to an excessive number of elements, applying filters by date and size can help focus on the most relevant tables.
This method supports proactive storage planning and periodic cleanup of unused or temporary data using standard Data Archiver tools ((including removing outdated records from the DBTables module itself), helping maintain optimal performance of the instance. As always, your feedback is welcome and appreciated!

