Author: Yuri Gee
7 minute read time
This article demonstrates how to display and count multi-select field values in standard SugarCRM charts and drill-down dashlets using out-of-the-box (OOTB) tools like Custom Query, Module Builder, and the Import CSV wizard.
Scenario Overview
Imagine having a multi-select field (source2_c) in the Leads module, which utilizes a stock list (lead_source_dom) to categorize the sources of a Lead.
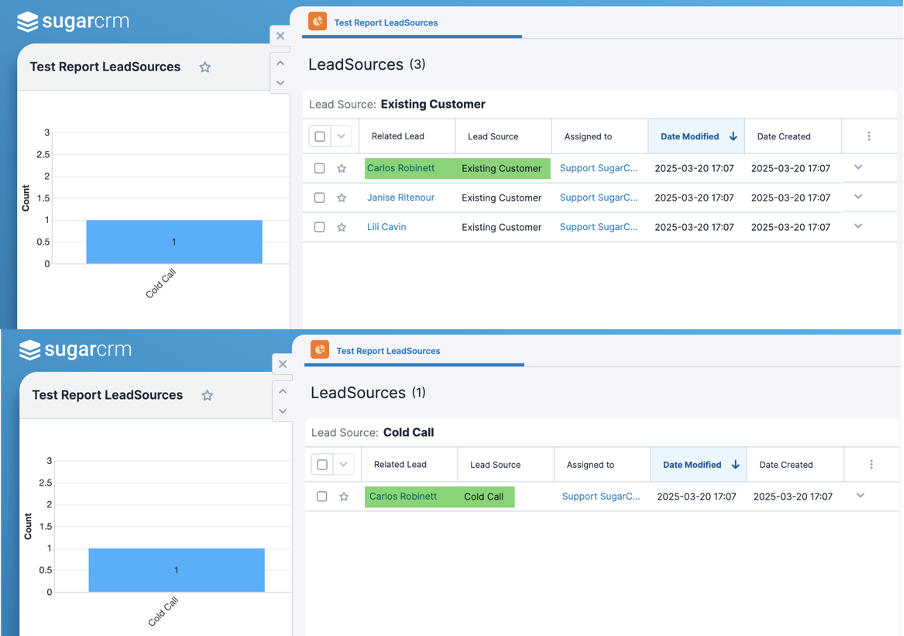
The objective is to create a standard SugarCRM summation report accompanied by a chart that illustrates the frequency of each source category's usage, while also showing the related leads for each category within drill-down dashlets.
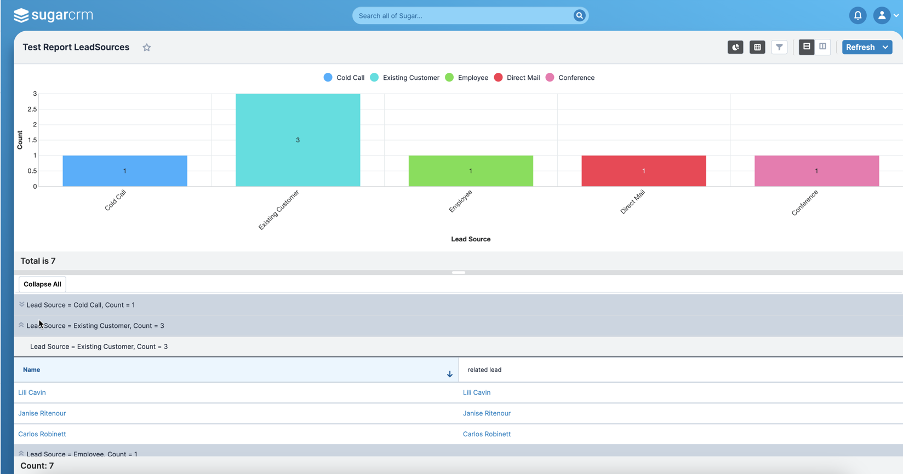
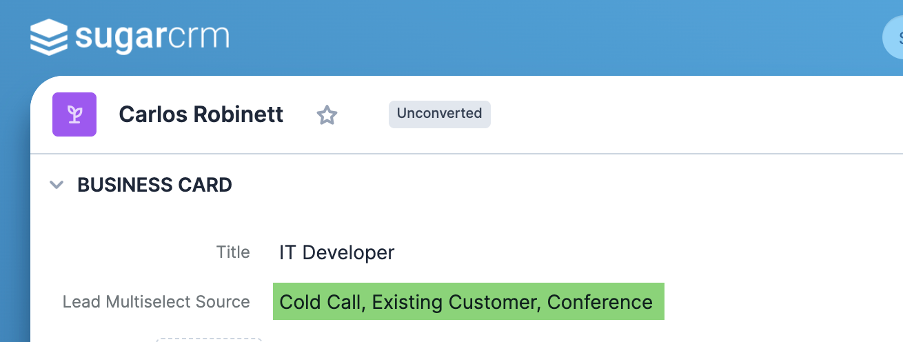
For example, Lead Carlos, who was sourced through multiple channels such as Cold Call, Existing Customer, and Conference by different employees, will be displayed in the drill-down dashlets for each respective category. Additionally, he will be counted individually in each source category on the chart.
Creating a Module Using Module Builder
To make the most of stock report charts in this scenario, it's necessary to have a table that transforms all multiselect values associated with each Lead into a series of rows. Each row will feature an individual lead's source in a column named lead_source.
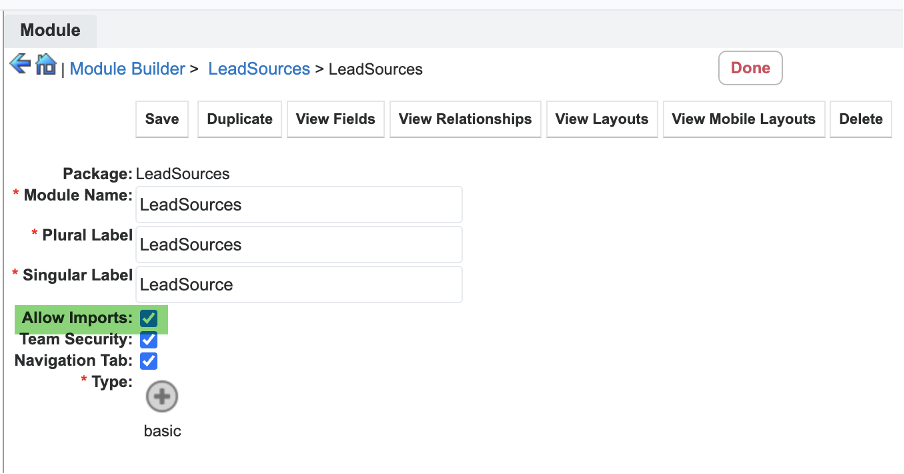
This can be accomplished by building a module, referred to as LeadSources, which supports imports and includes the following essential fields:
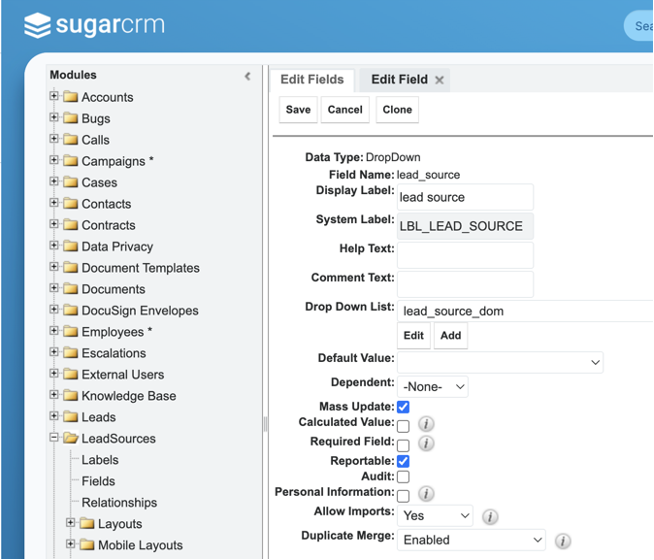
lead_source: A dropdown field reflecting the lead_source_dom list used for lead source values.
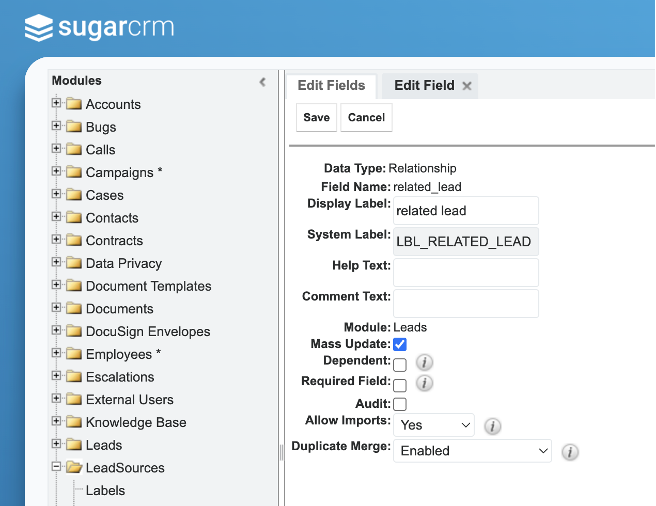
related_lead: A "Relate" field linking the LeadSources module to the Leads module.
After deploying this module through Module Builder, it will be accessible in Studio. In Studio, the specified fields can be added into the List View layout, allowing them to appear in the report's drill-down dashlets.
Creating a Custom Query
The query from the previous article is then utilized to generate the necessary data for Leads, which is subsequently imported into the LeadSources module.
select concat(ifnull(c2.first_name, ''), " ", ifnull(c2.last_name, '')) as 'Name', c2.id as 'related_lead', a.lead_source_c as 'lead_source' from (
select 'Cold Call'  as lead_source_c
union select  'Existing Customer'
union select  'Self Generated'
union select  'Employee'
union select  'Partner'
union select  'Public Relations'
union select  'Direct Mail'
union select  'Conference'
union select  'Trade Show'
union select  'Web Site'
union select  'Word of mouth'
union select  'Email'
union select  'Campaign'
union select  'Support Portal User Registration'
union select  'Other') as a
inner join leads_cstm c on (find_in_set(a.lead_source_c,
replace(c.source2_c,"^","")) <> 0 )
inner join leads c2 on c2.id=c.id_c and c2.deleted=0
group by a.lead_source_c, c2.id order by c2.id desc, a.lead_source_c desc;
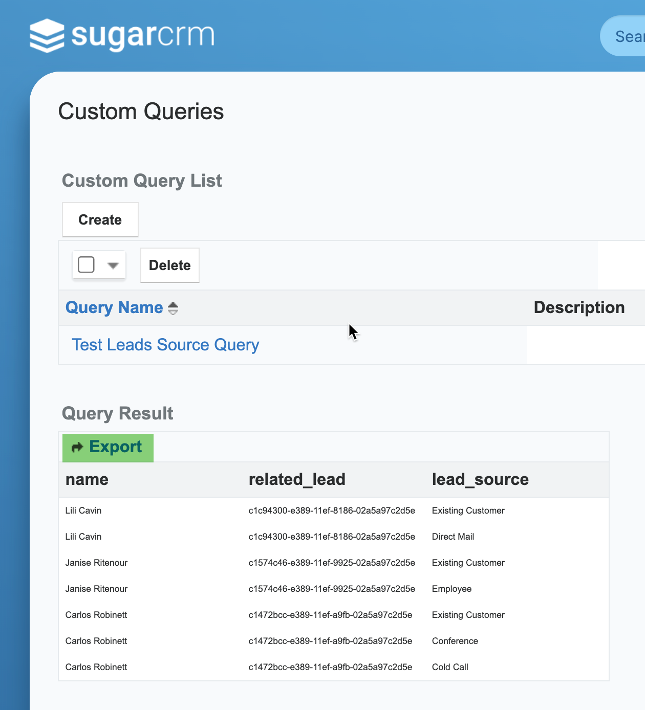
The query will produce the following output:

Exporting and Importing the Query into the LeadSources Module
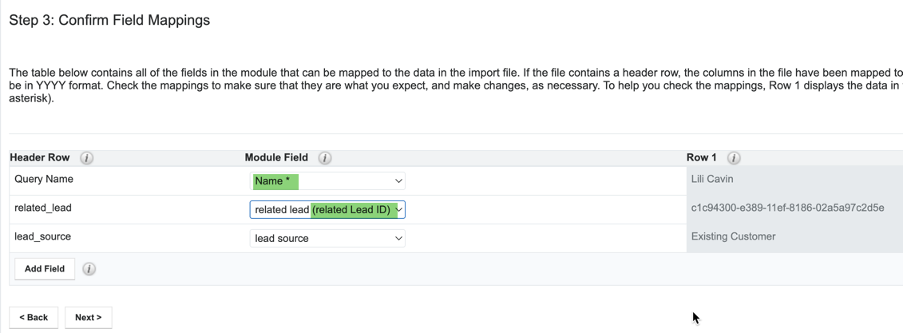
The next step is to export the query results and import them into the LeadSources module using the CSV import wizard. During the import process, ensure that the fields are mapped correctly. For the Relate field, it is crucial to map the 'related lead' column to the corresponding Leads ID.
Constructing the Final Report
Finally, to create the Summation report within the LeadSources module, follow these following steps:
Filters: Set "Date Created" to on or after Import date.
Group By: LeadSources → lead_source field.
Display Summaries: LeadSources → lead_source and Count.
Display Columns: LeadSources → Name.
Chart Type: Vertical Bar (Stacked).
The resulting chart will resemble the one shown earlier in the article, organizing and accounting for each individual multiselect category.
Additional notes
The LeadSources module content can be generated through multiple approaches, including database imports, workflows, or logic hooks. Unneeded data can be permanently deleted by navigating to Admin → Archive Record in hard delete mode, which will permanently remove the supporting records from the database.
This method is versatile and can be applied to various multiselect field configurations, including those in related modules such as activities, calls, and meetings. Your feedback and insights on using these features are greatly appreciated!
