Successful sellers and managers must keep track of their individual and team pipelines. At SugarCRM, we are committed to enhancing user experience and product functionalities so that you can work faster and more efficiently.
The recently redesigned Report Dashlet has boosted your ability to view and interact with reports in Sugar Dashboards. With the 13.1 release, we took that flexibility one step further with the introduction of Dashboard Filters. Dashboard Filters allow you to filter multiple report dashlets on your dashboard at the same time.
Where to find it? The Dashboard Filters button (funnel icon) appears in the top right corner of the Home dashboards. Please note that you must have at least one Report Dashlet with a run-time filter already applied on your dashboard to use this filter.
You can easily see how many filters are on a dashboard by checking the number badge on the Dashboard Filters button.
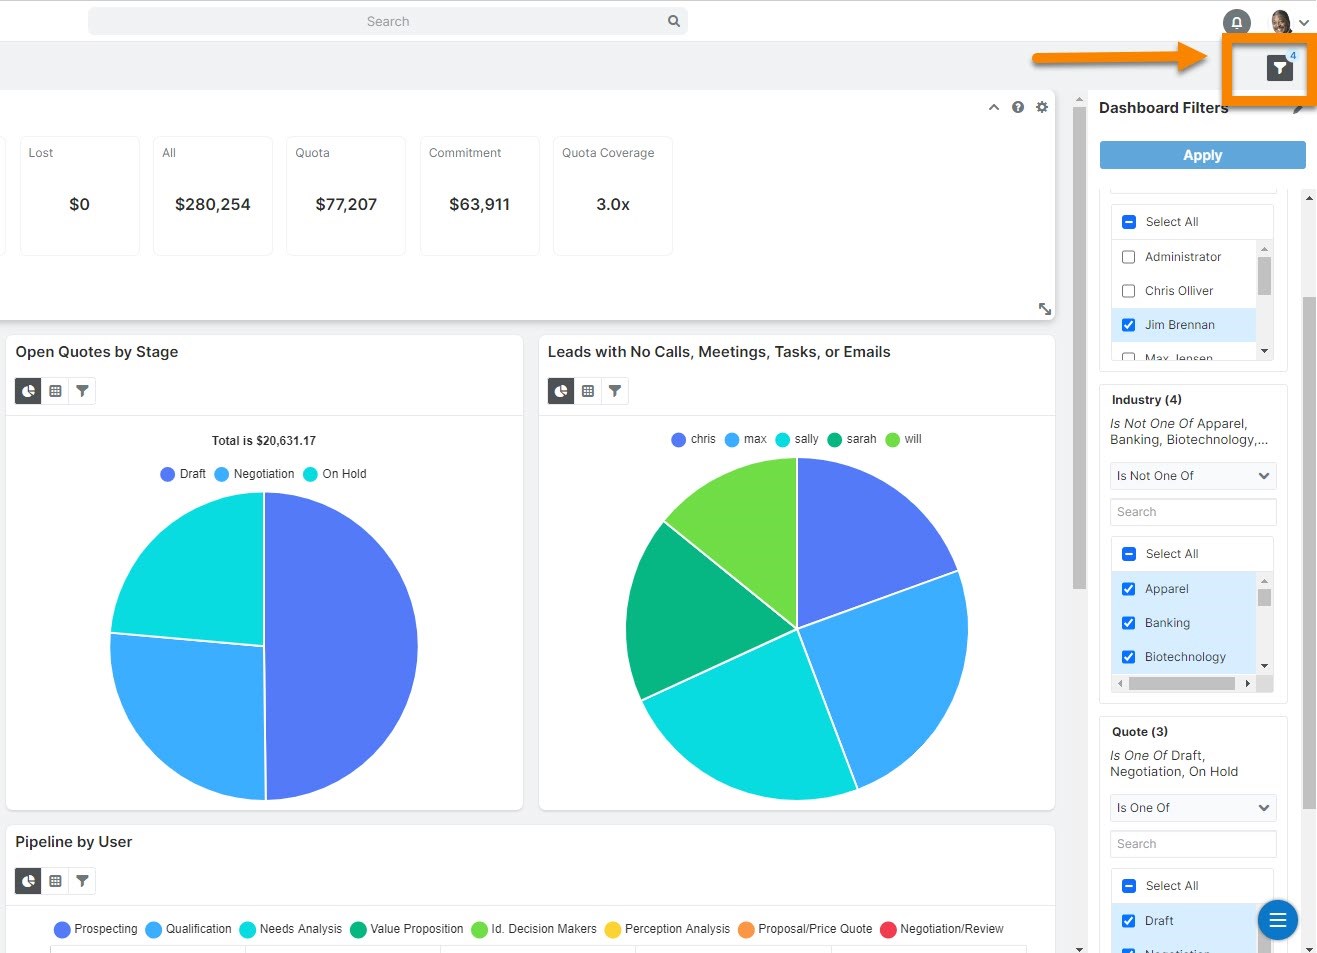
Dashboard filters control the run-time filters already applied to one or more report dashlets on your dashboard. When using a dashboard filter, simply hover over the dashboard filter in the Dashboard Filters panel to highlight the affected dashlets so you know which dashlets you are controlling.
In the example below, when hovering over the Industry filter group, the affected Report Dashlets are shown. Changing the filter to Assigned User highlights the corresponding Report Dashlets.
Please keep in mind that Dashboard filters are not available on the Sales Console or Service Console— the Dashboard Filters button is removed entirely from the consoles. In case you are not aware, the Sales Console has replaced the previous "Renewals Console" to better reflect our console flexibility and improved functionality.
How to use it? Dashboard Filtering is an easy way to alter all the dashlets’ results at once by changing the filter values without applying the filter to each report dashlet individually.
Step 1
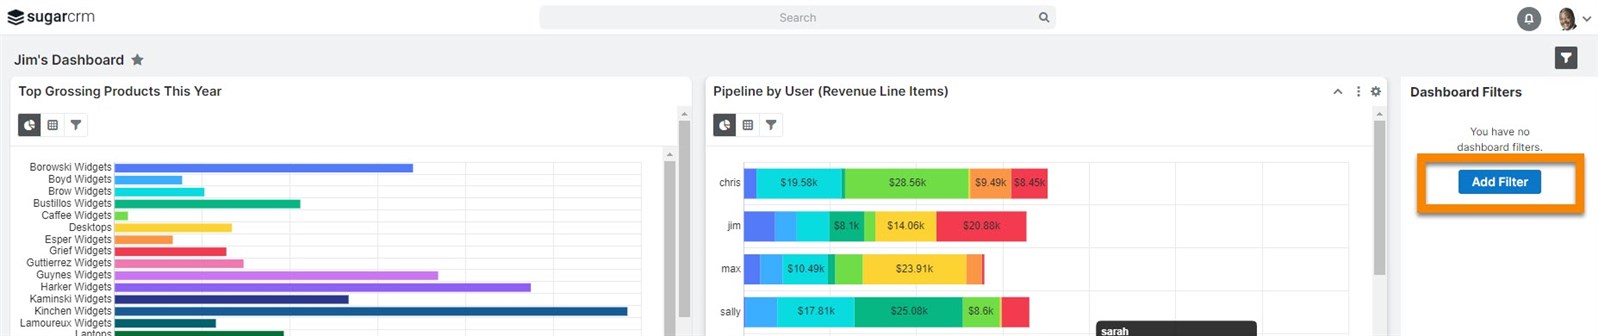
To create and utilize dashboard filters that are most useful for you, click the Dashboard Filters button (funnel icon located at the top right corner) on the home dashboard.
If no dashboard filters exist, click the Add Filter button to create a new filter.
Step 2
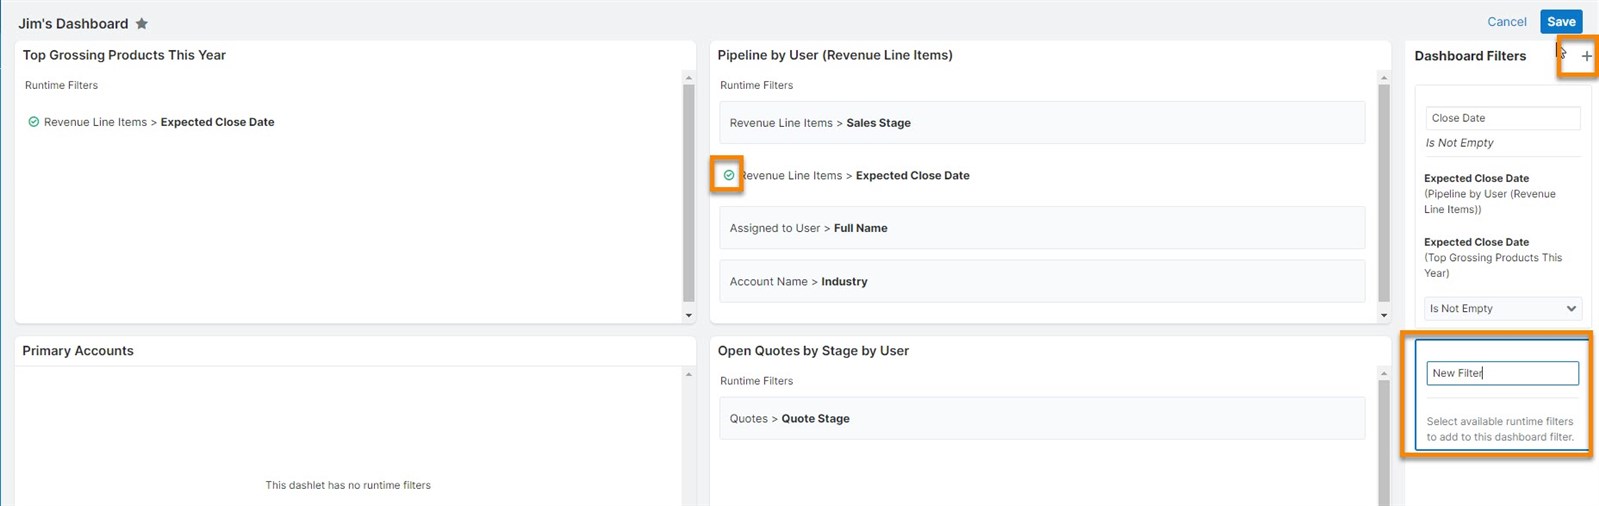
Provide a name for the dashboard filter, then click on each run-time filter that you want to add to the group, then click Save.
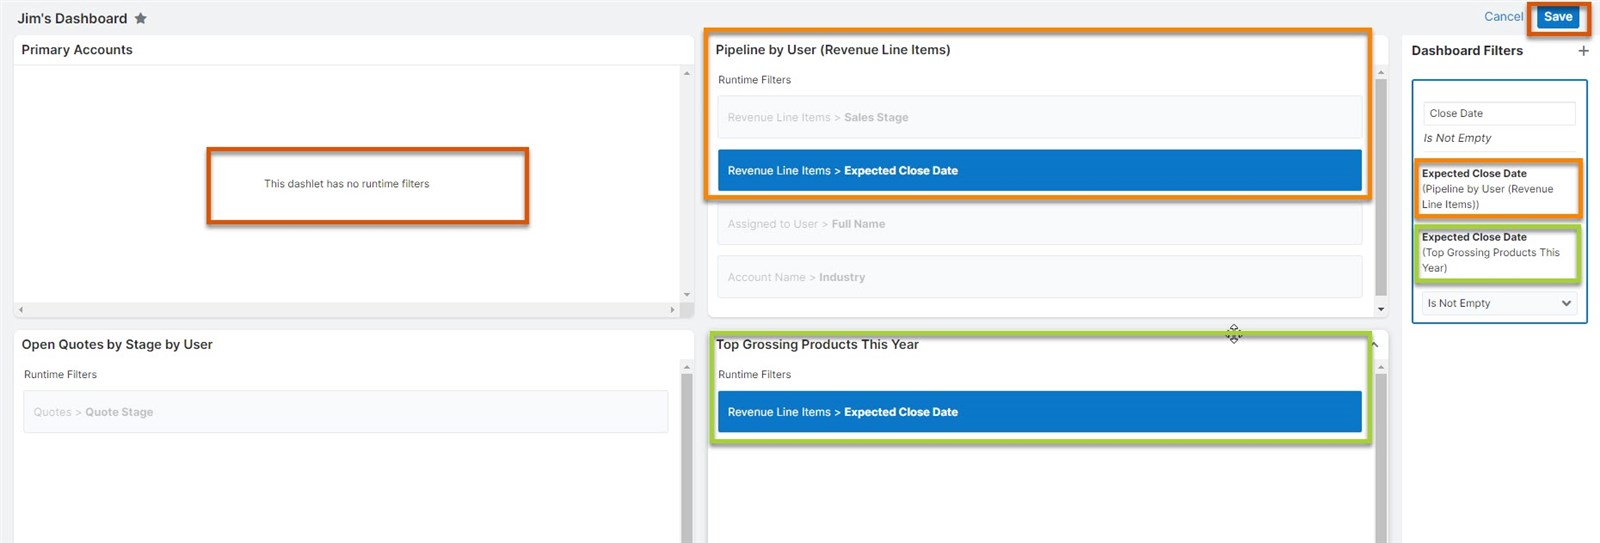
Please note that you cannot apply Dashboard Filters to dashlets that are not a Report Dashlet or a Report Dashlet that does not have run-time filters applied.
If you need to add another dashboard filter, click the plus icon in the upper right corner of the Dashboard Filters panel. Note that run-time filters that have already been used in a dashboard filter cannot be reused, and a checkmark appears next to its name.
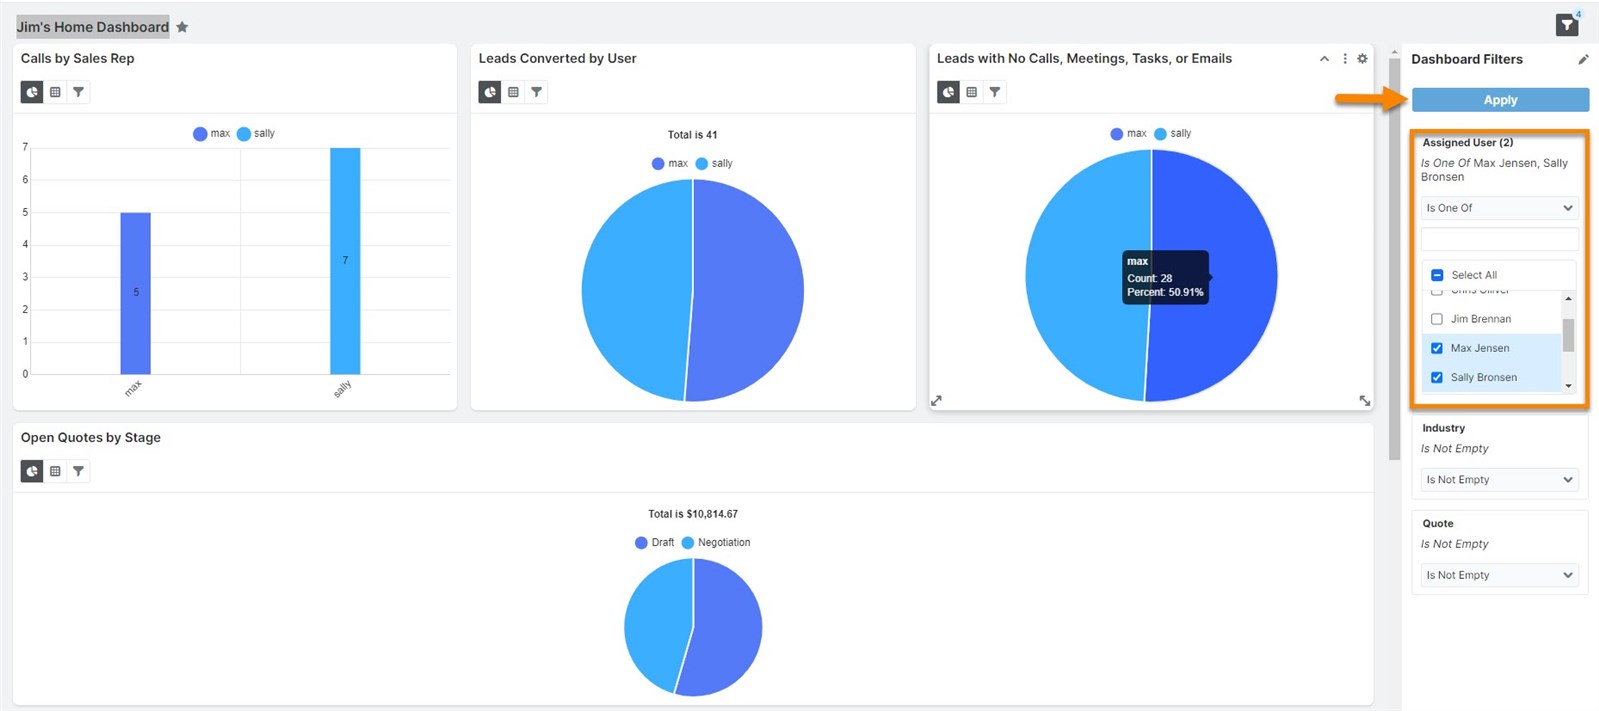
Imagine that you are a sales manager who needs to monitor the performance of your new sales representatives, Sally and Max. You want to track their progress on Calls, Leads Converted, Leads with No Calls, Meetings, Tasks, and Emails, as well as their Open Quotes by Stage.
In the image below, you can see their names selected in the Assigned User filter group. Click Apply to view the dashlets that show data exclusively for Max and Sally. The “Industry” and “Quote” filters will stay on the default value of “Is Not Empty” since we are only interested in displaying Calls, Leads Converted, Leads with No Calls, Meetings, Tasks, and Emails, as well as their Open Quotes by Stage for all industries and all quote stages.
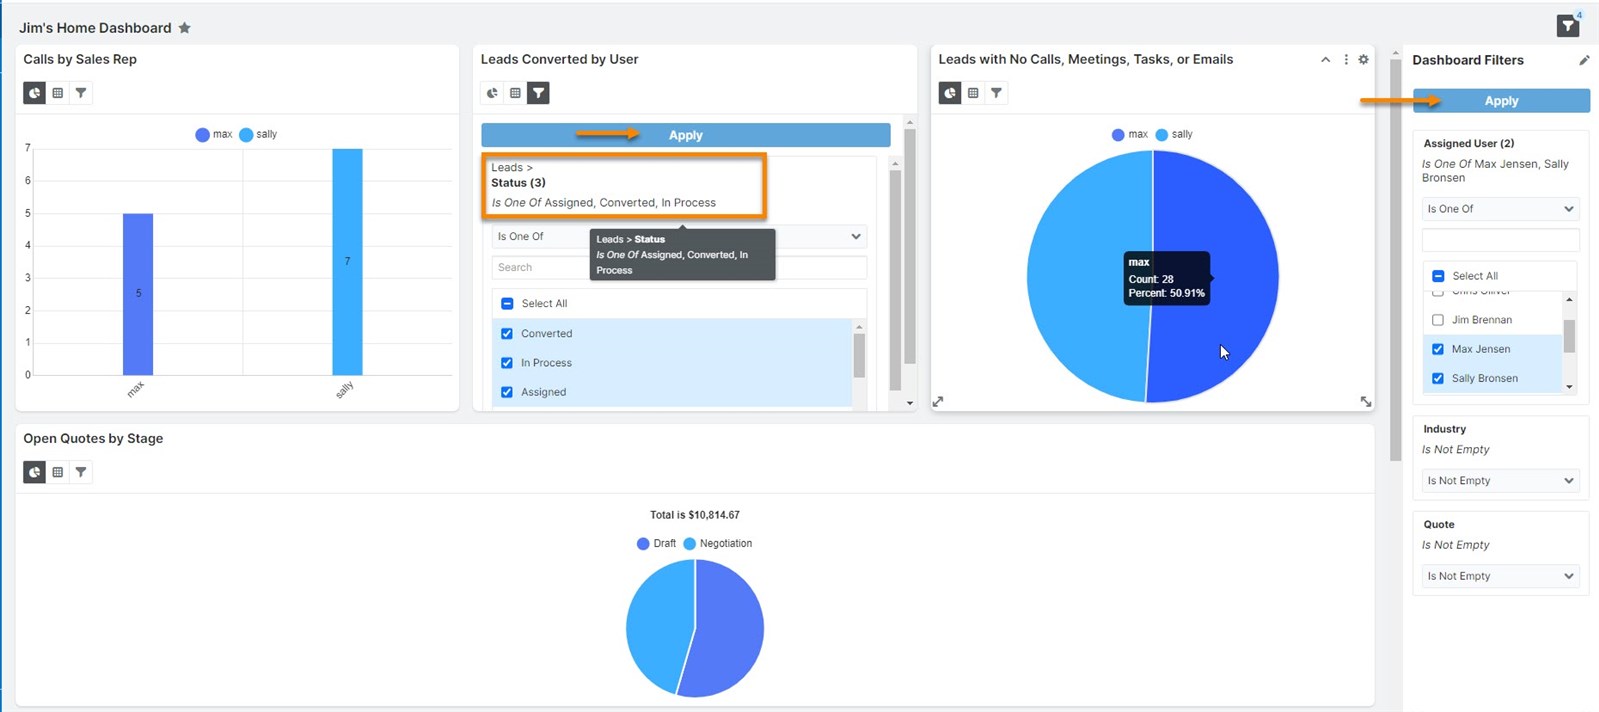
Fun fact! When utilizing the dashboard filters, you can still apply any available run-time filters on the dashlet itself to refine your search even further.
For example, if you want to see only the Leads with Assigned, Converted, or In Progress status (for the same scenario), click Apply on both the dashlet run-time filter and the Dashboard Filters to obtain the expected outcomes.
Here are some best practices we recommend when using Dashboard filters:
We are determined to make hard things easier. By introducing Dashboard Filters, your teams have a simplified dashboard experience and the option to easily filter all their report dashlets with just a few clicks. To see Dashboard Filters in action, you can watch next video:
We’re excited to see the results you’ll achieve when you start using this new feature. You may share your thoughts on SugarClub, and stay tuned as we are continually adding relevant content.


