Hey there, SugarCRM enthusiasts! Welcome to the fourth SugarClub installment of our "Hidden Features" series. This ongoing series covers less commonly known features in Sugar Sell and Sugar Enterprise. Please reach out if you have suggestions about a feature/capability we should highlight! We'd love to have your feedback. Note: This feature is also available in Sugar Serve.
Have you ever felt like you're swimming in data and drowning in a sea of reports? Fear not, because we're about to introduce you to a fantastic feature that's been flying under the radar — contextual report dashlets. Trust us; it's a total game-changer!
Okay, let's set the stage. You're navigating through Sugar, working your magic, and you stumble upon a report dashlet. It's no secret that dashlets are your trusty companions, helping you visualize data and insights right within your Sugar views. But wait, there's something new here — a tiny checkbox, almost winking at you. It reads: "Related to the Current Record."
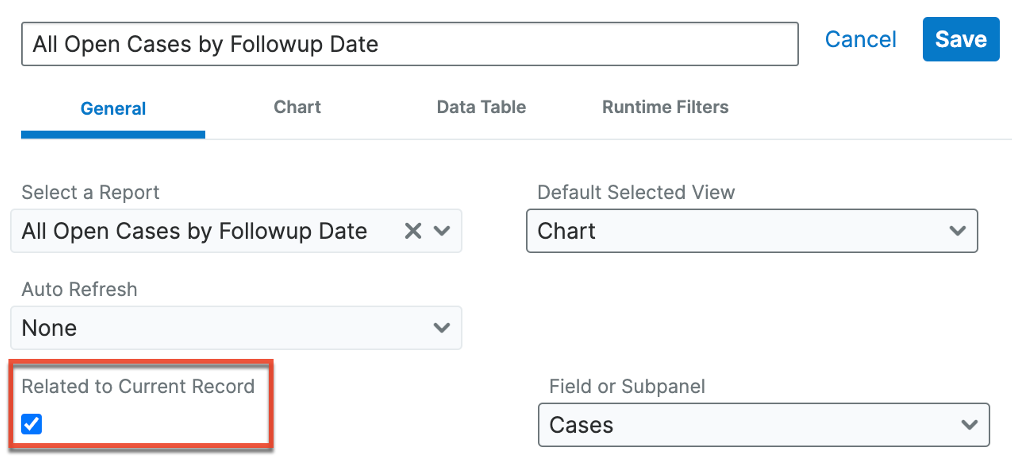
In the screenshot above, you can see the Field or Subpanel dropdown. This dropdown appears when you enable the checkbox. Choose the field/subpanel relationship to show the contextual information. This example uses a cases report on an account focus dashboard and we're telling it to pull the cases from the Cases subpanel on the account.
Believe me when I say, you don't want to overlook this checkbox. When you "check" it, your report dashlet transforms into something extraordinary --your personal data wizard. It conjures up results and charts tailored to the very record you're currently viewing to give you the results you need when you need them.
Let's dive a bit deeper into this magic. Imagine you're on a record view or focus drawer, working your way through details that matter to you. With contextual report dashlets, the charts and results you see are like a meticulously crafted suit — perfectly tailored to fit the context of that specific record. It's like having a personal data assistant that whispers insights directly into your ear.
And here's the best part — it's crazy powerful, yet incredibly simple. Just check that little box, and you'll unlock a whole new dimension of understanding your data.
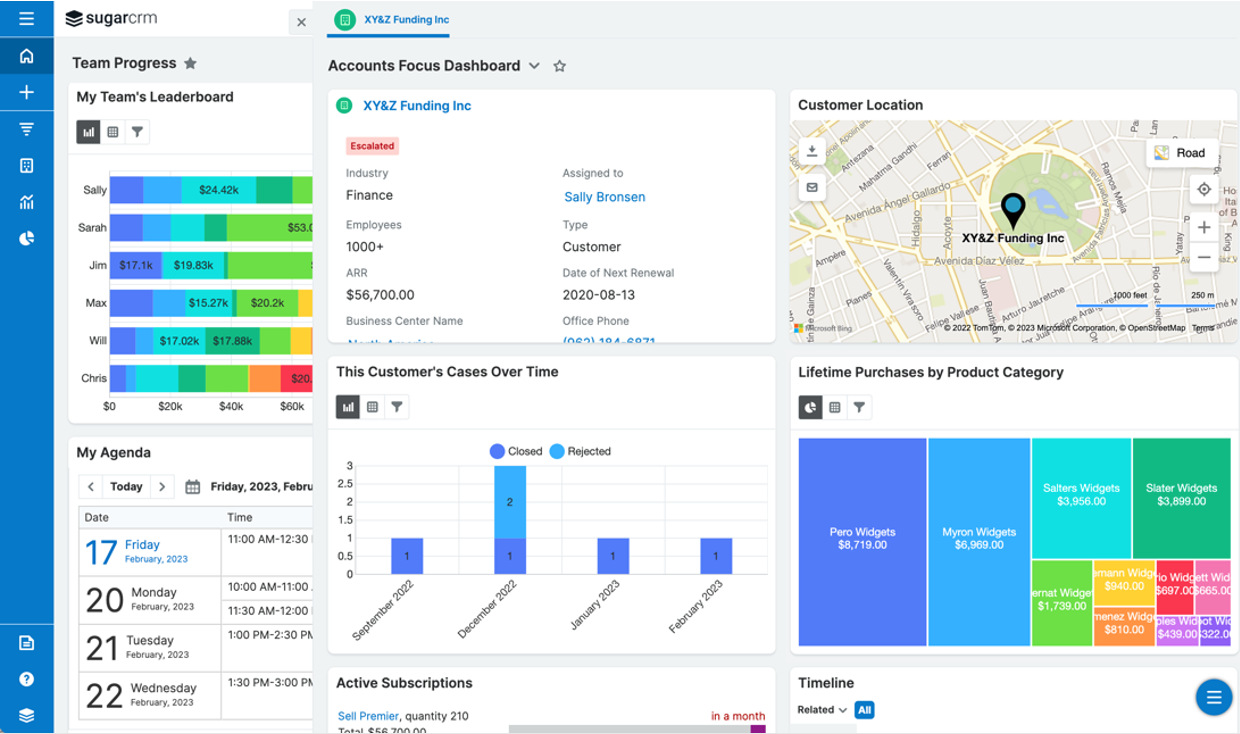
Adding context-aware charts to your focus drawers and record views is the perfect answer to a wide range of goals and use cases. In the example above, the focus drawer automatically visualizes two key charts when looking at an account. First, it shows each account's case volume over time. This allows reps to immediately know if the customer needs further assistance and allows them to quickly see trends. It also removes the need to dive into every single case individually. Finally, it shows each account's lifetime purchases grouped by product category to quickly visualize the products the customer has historically purchased.
Here are a few more suggested use cases:
Or you could track meetings and other touchpoints over time with a specific customer or prospect to determine the best sales and marketing approaches specific to them.
So, now you understand your contextual report dashlet shows you incredible insights. But what if you want to tweak it a bit? Just click on the gear icon at the top of the dashlet menu bar and select "Edit." Voila! You're now in the dashboard driver's seat, ready to mold that dashlet to your liking, whether it's adjusting parameters, choosing what data to display, or picking the perfect chart style. Once you're satisfied, hit that "Save" button and your custom creation is locked in.
Now, you might be wondering where these dashlets reside. While report dashlets are available on all dashboards, including home dashboards, this contextual capability (and its checkbox) is only available when you're looking at a single record. This means you can find it on both the record view and focus drawer view in sidecar modules. The checkbox doesn't appear when using this dashlet on home page dashboards since the user wouldn't be looking at a single record by which to filter report results.
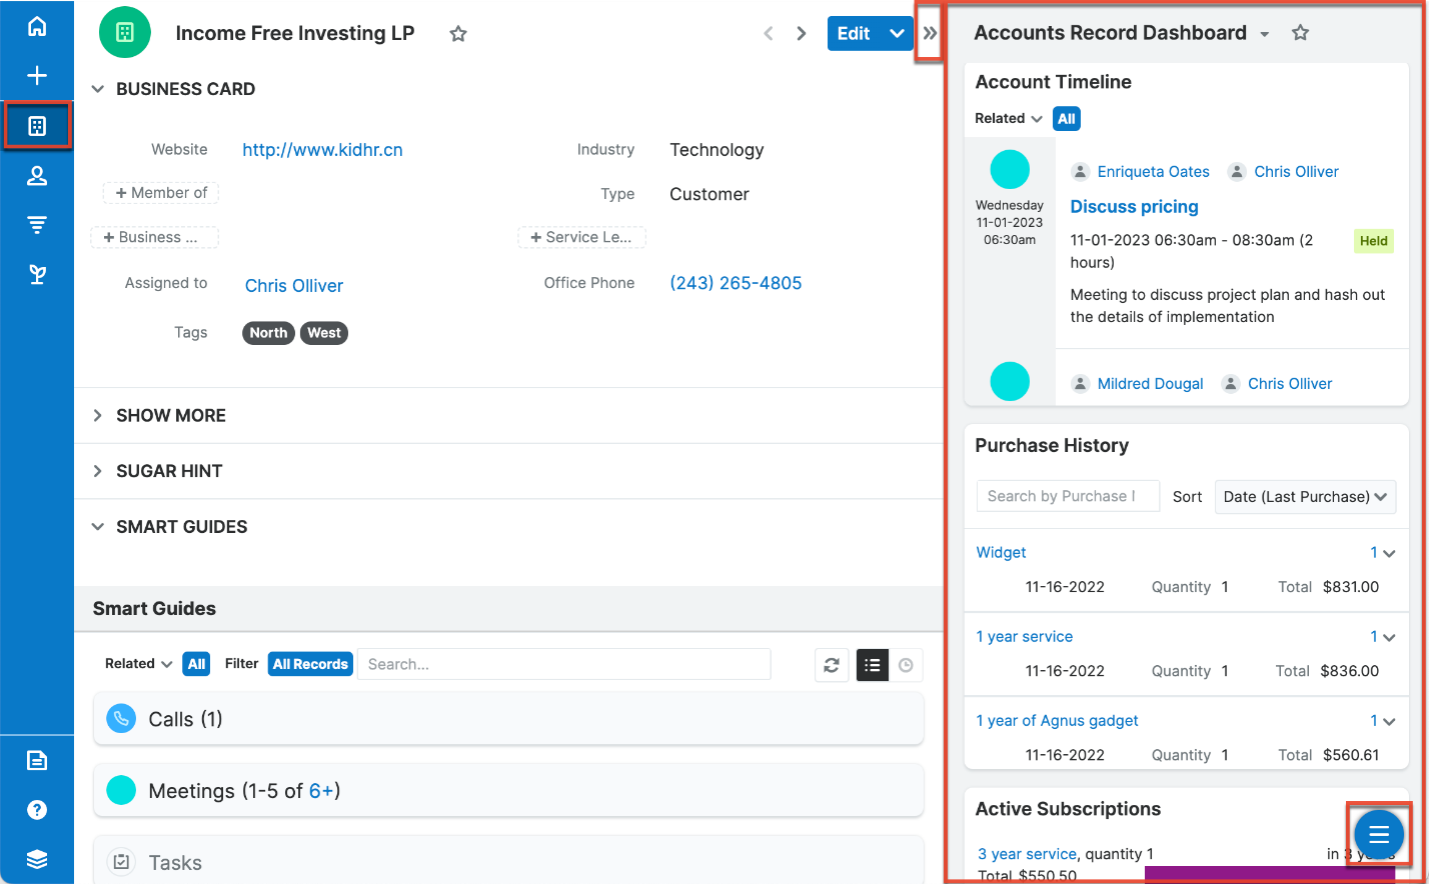
For example, to access the Accounts record view dashboards, click the Accounts module tab in the navigation bar. Then, click one of the account names that appear on the list view to open its record view. Ensure you've opened the "Intelligence Pane" by clicking the arrow icon at the top right of the list view, as shown in the image below.
Speaking of dashboards, SugarCRM has your back with default dashboards that include commonly used dashlets. But, as with everything Sugar, you're not limited to the default settings.
Dashboards are a playground for Sugar admins and end users. While the out-of-the-box default dashboards belong to the admin user (and therefore can only be modified by them), admins can also reassign these dashboards to a manager to edit, and each individual user can create their own dashboards. Imagine having the ability to create dashboards that perfectly match each user's needs—including those specific "related to current record" datasets required for deep dive data analysis. The possibilities are almost endless!
Now you understand why contextual report dashlets are the unsung heroes of data visualization! They are your secret weapon for understanding your records on a whole new level. Remember that checkbox — it's your ticket to unlocking a world of insights tailored just for you. Embrace it, edit your dashlets, and customize your dashboards to create a SugarCRM experience that's uniquely yours.
Ready to take your data game to the next level? Dive into contextual report dashlets and dig into newfound insights and possibilities. Your data journey is about to get a whole lot sweeter!


