Hello!
I created a report with the type "sum with details" where I want to know the difference between the old and new revenue (or the difference between the revenue for this and last year) for an employee.
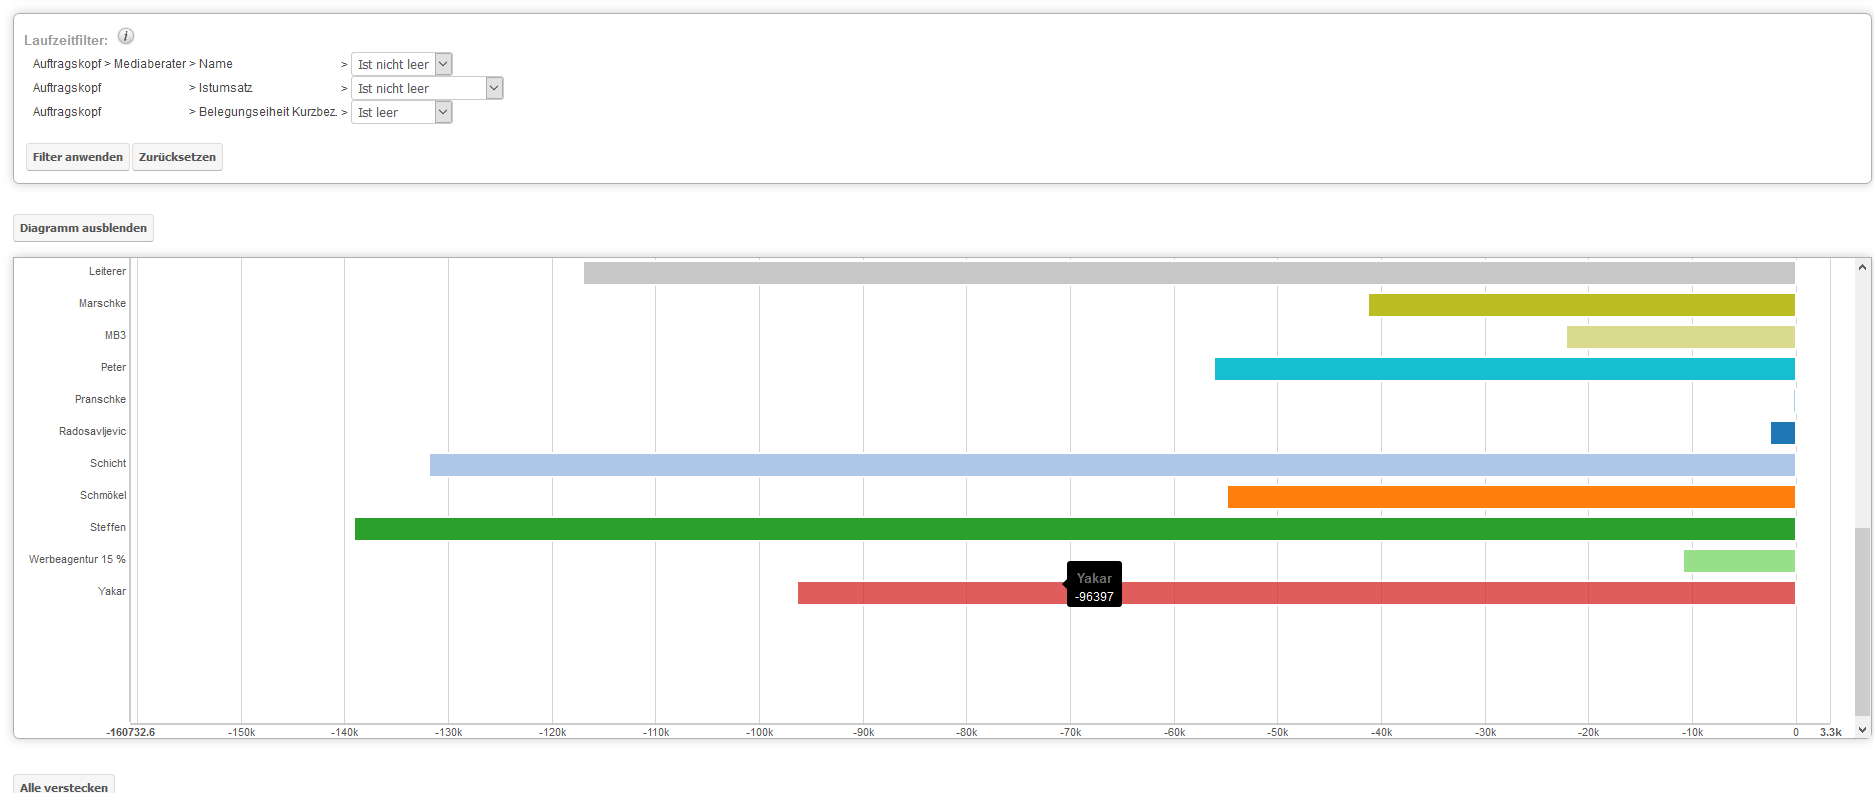
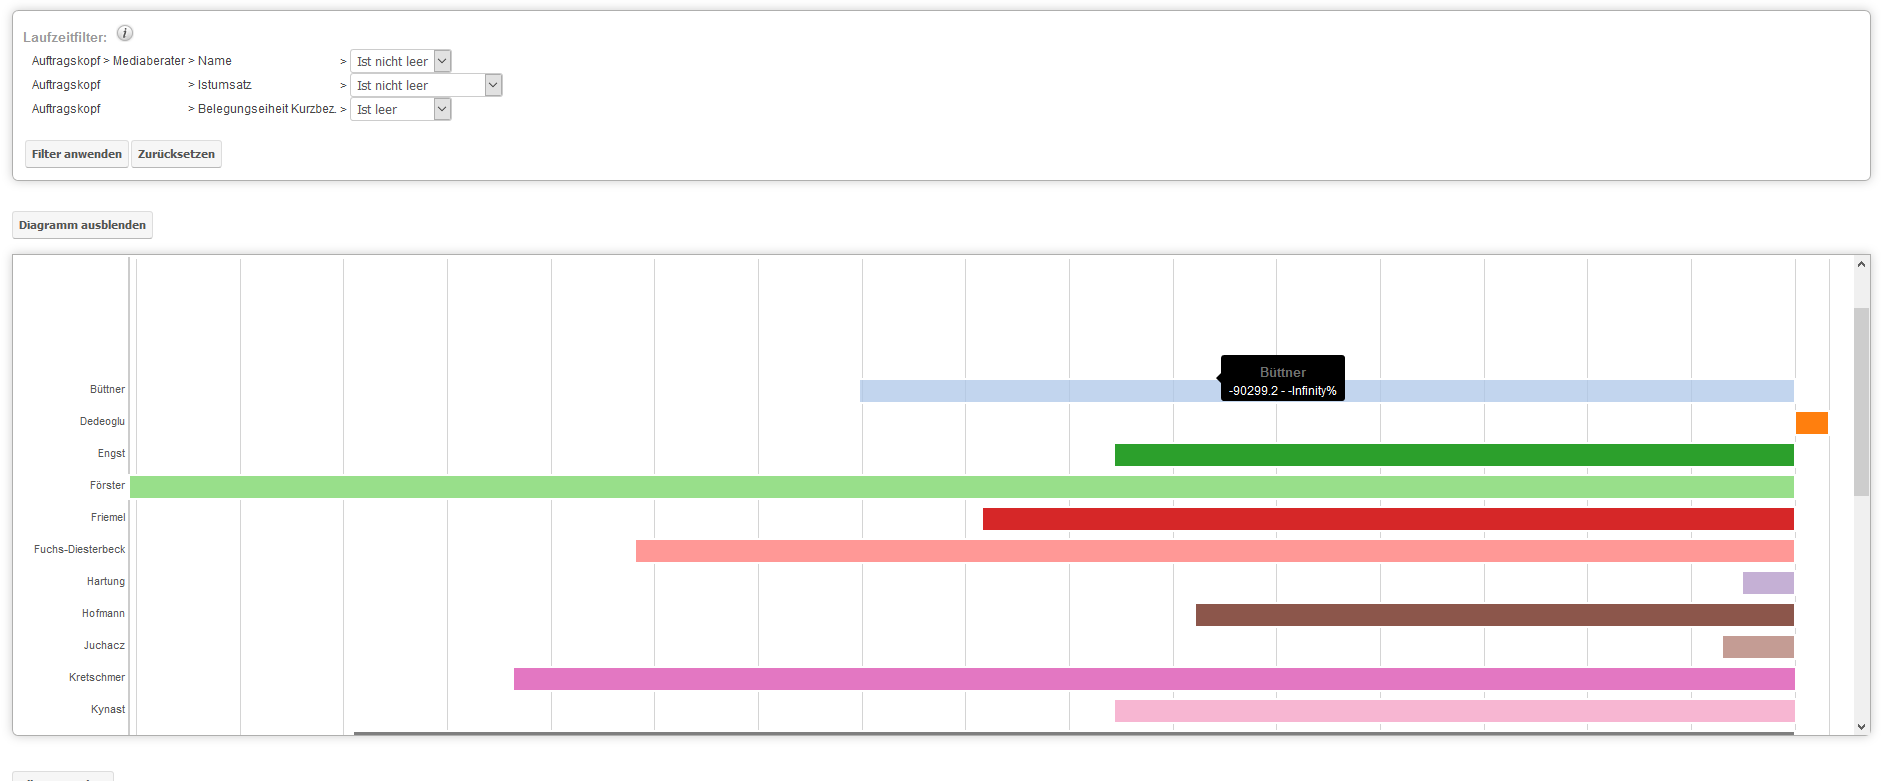
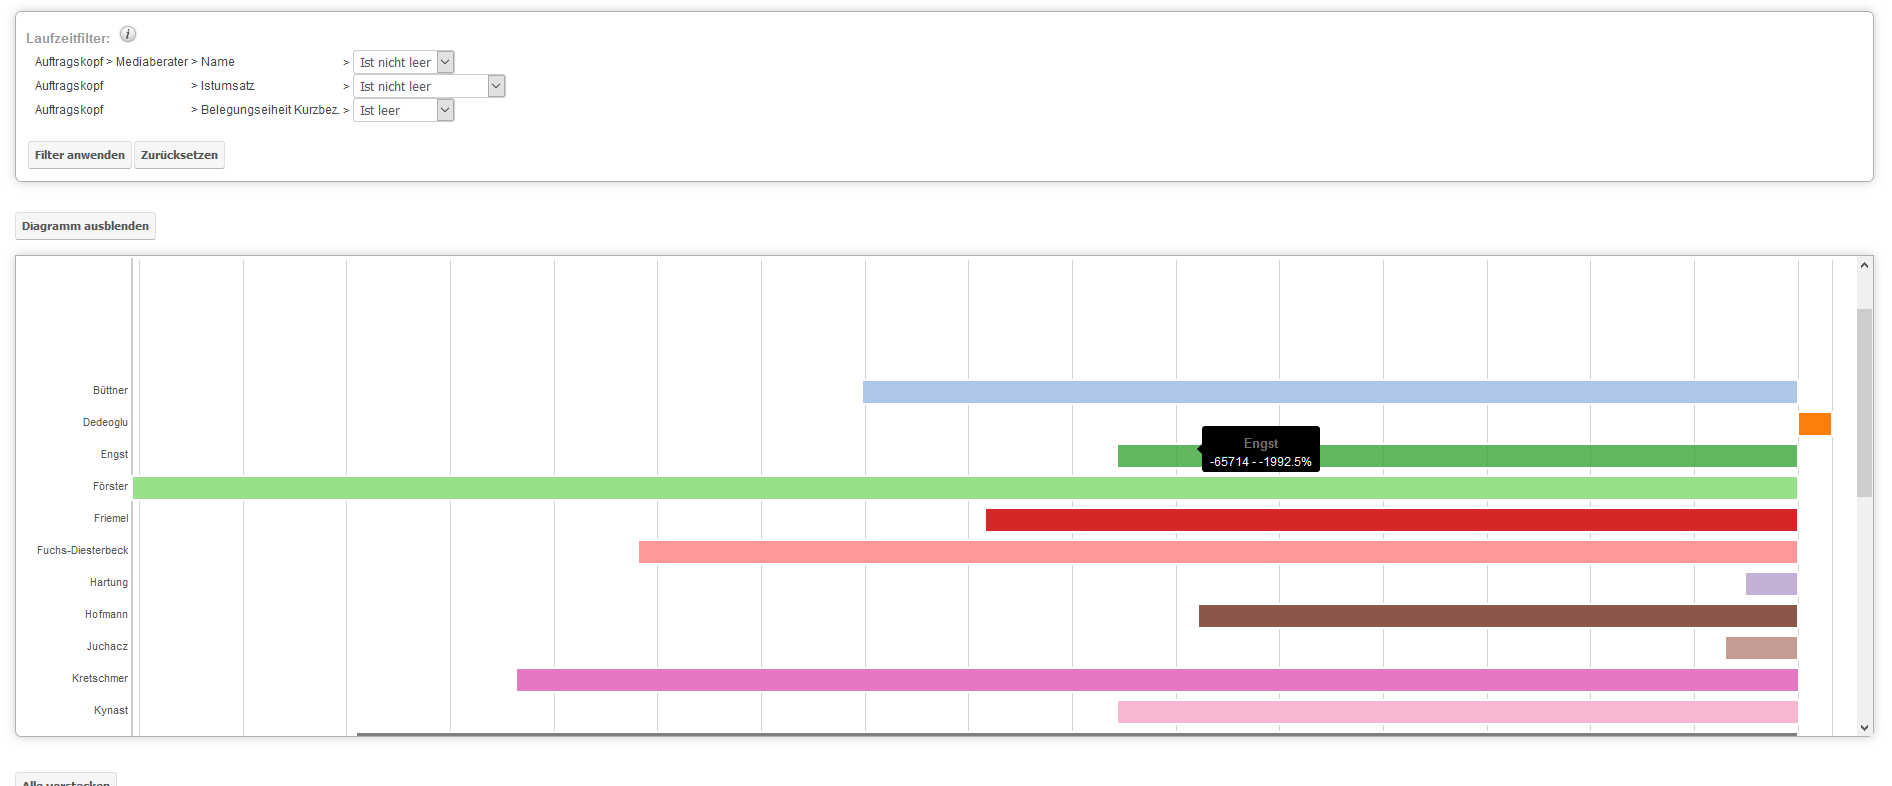
When I run the report, there is my chart with the bars. The calculated difference is correct (the first value when I hover over a bar). But what does not make sense is the second value (see attached files). There is infinity% (seems like a placeholder) or a percentage or nothing. So what is infinity%? And why there are for some bars the value infinity, why for some bars a percentage (with the wrong percentage for the calculated difference, should be rather 90% than 2000%) and why there is somethimes no percentage?
Does anybody know what the problem could be and what "infinity%" is?
Thanks for the help!