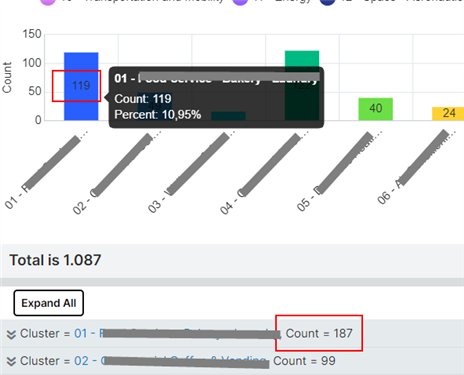
On a report "Summation with details", I get two different values on the bar chart and on the table underneath the chart.

Isn't it misleading?
Thanks
On a report "Summation with details", I get two different values on the bar chart and on the table underneath the chart.

Isn't it misleading?
Thanks
Hi Omar,
There are a few things that might be happening:
- The table may have deleted records (where the deleted field is equal to 1). Sugar periodically removes these records with a "prune database" scheduler - so they will eventually be removed if that job is enabled.
- Your report may be affected by team security where your logged in user doesn't have full visibility to all the records.
- Your results may be affected by a join in your reports filter query. Make sure you flag the "Optional Related Modules" when necessary.
Hi Omar,
One additional possibility is that your report details are returning the same record multiple times. This can happen if you are including a display field or filter condition from a related module that has a many-to-one or many-to-many relationship with your primary module. In those instances, a row will show in the report for each related record. However, the chart in the report only shows a unique count of records for each grouping.
Chris
Hi Chris Raffle,
that's the case.
I understood it's better to use Summation record, without details to have a precise correspondence between chart and table.
thanks
Omar