Our May Social Club session on May 8th was all about reporting, and we covered a lot of great tips and tricks! With Sugar’s reporting functionalities continuing to evolve, there was no shortage of creative ideas and enthusiastic discussion around how to use them more effectively. A big thank you to Lydia Manger and Andrew Yeates, who shared their expertise on Sugar's standard report functionality and Enhanced Forecasting using Sugar Discover. Here’s a look at what we covered and some of the key takeaways.
Andy walked us through some powerful ways to take advantage of report filters within dashboards and how they can simplify workflows and improve adoption across teams. These filters can help users quickly toggle between views, focusing on territories, teams, and more, without needing to build separate dashboards for each variation. To use this feature, configure “Run Time Filters” on your reports and then add those reports to your dashboard.
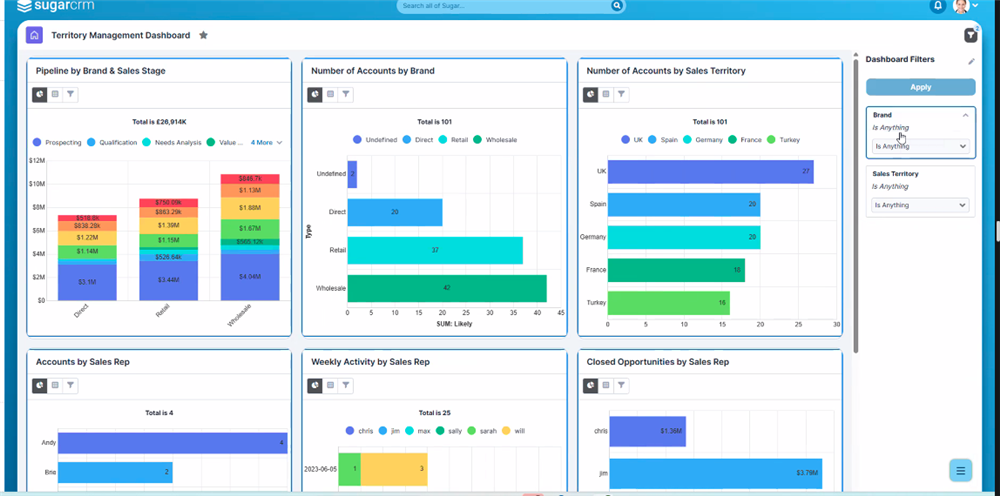
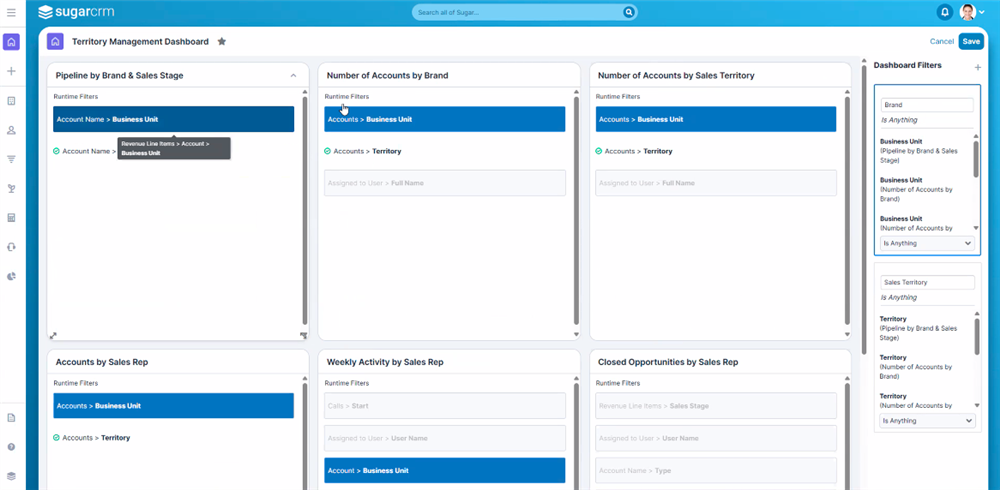
A few tips that stood out:
We took a quick detour from reporting to discuss the new Last Interaction Date field, added in the recent 25.1 release. This field reflects calls and meetings associated with the account, but doesn’t (yet) include emails or other activities, so we discussed its use and benefits and how that may affect organizations differently depending on how you communicate and engage with contacts and accounts. There was also a great reminder to avoid overloading custom versions of this field with too much logic. Instead, consider using separate fields for each type of activity (like “Last Case Date” or “Last Opportunity Date”) to provide more clarity and structure for users, as defined customer touchpoints may vary between organizations.
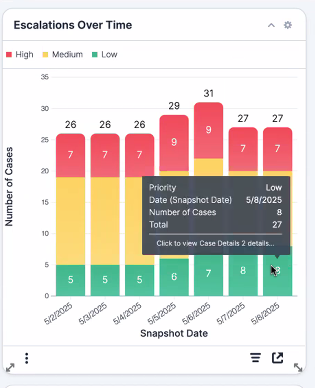
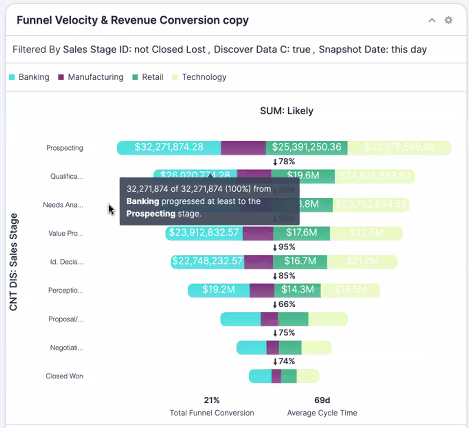
Lydia then took us deeper into Enhanced Forecasting/Service Insights (Sugar Discover), which is especially useful for teams looking to analyze how data has changed over time. Traditional reporting in Sugar (Sell, Serve, and Enterprise) shows what your data looks like today, while Enhanced Forecasting in Discover gives you historical context, helping you track how your pipeline has evolved over time, such as comparing pipeline values by week, quarter, or other time intervals.
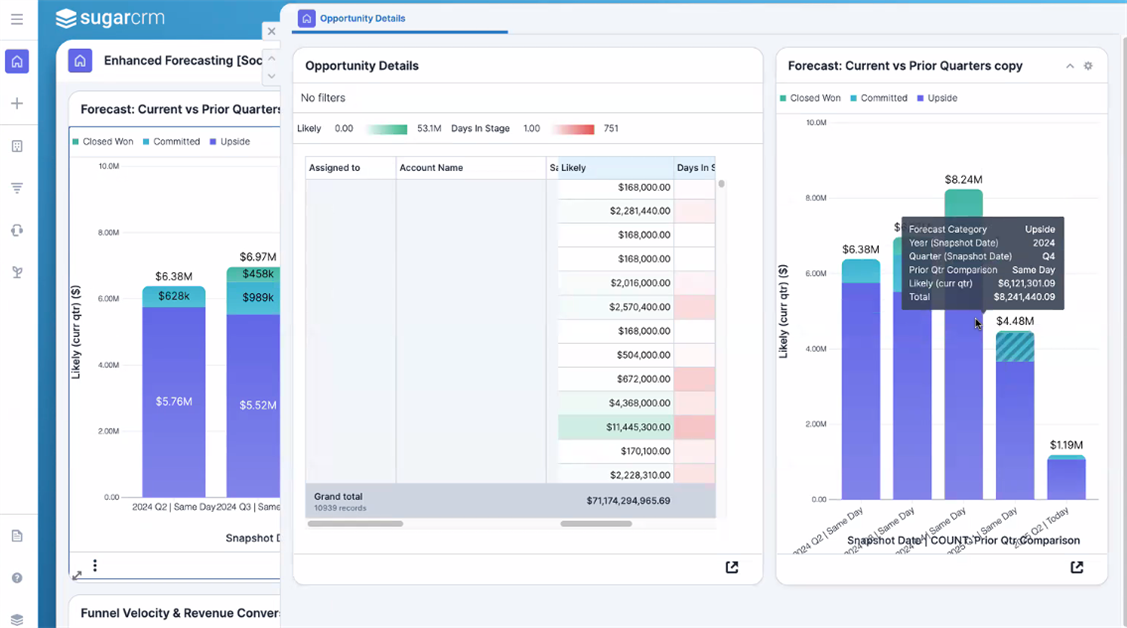
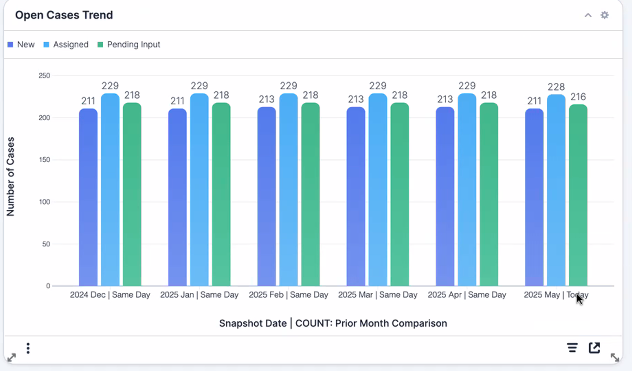
Some additional highlights:
Our next Social Club session will take place on June 12th, Social Club: Doc Merge Tips & Tricks. We’ll explore practical ways to use Doc Merge to streamline processes and make document generation more consistent and user-friendly.
Thanks to everyone who joined us for this session, and to Lydia and Andy for sharing so many great tips and recommendations. Hope to see you next time!


