
If you’ve ever found yourself scratching your head over differences between your email dashboard statistics and those in a Campaign Summary Report, you’re not alone. This is a common question we receive, and it usually comes down to how click-through rates (CTR) are calculated in each case.
Here is an example screenshot between the Global Dashboard and Campaign Summary Report:
Global Dashboard: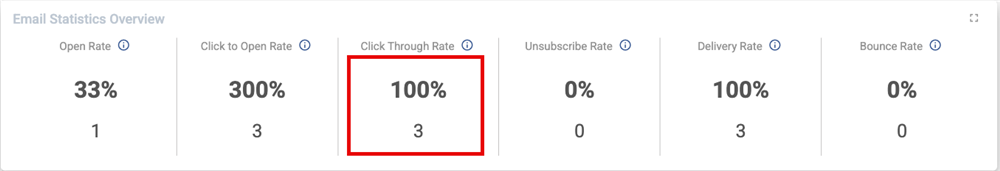
Campaign Summary:![]()
Let’s break it down:
In the email dashboard, the CTR is calculated using unique clicks divided by delivered emails. This means the dashboard is only counting each recipient’s first click, no matter how many times they click a link.
On the other hand, the Campaign Summary Report takes a different approach. It calculates CTR based on all clicks divided by delivered emails, not just unique ones. So, if a recipient clicks a link multiple times, each of those clicks will be included in the report’s total.
Key Differences
- Dashboard CTR = Unique Clicks / Delivered Emails
- Campaign Summary Report CTR = All Clicks / Delivered Emails
This distinction is why you might see a higher CTR in the Campaign Summary Report compared to the dashboard. Both numbers are accurate — they’re just measuring slightly different things.
If you have any further questions about how your email performance metrics are calculated, feel free to reach out to our support team!