Reports

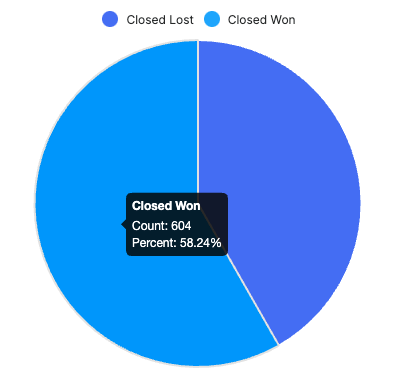
I am looking to build a report that shows:  

  • Win rate
  • Average deal size
  • Average sales cycle

Understand this is probably in forecasting but we are not ready to use that.  Can we show these without forecasting?

  • Hi  , I believe you can have something pretty similar with standard reports, as I did on a clean demo environment.

    For the Win Rate, assuming you want to know how many deals have been won out of the total of closed deals, you can have a standard report as follows:

    - Report Type: Summation Report

    - Module: Opportunities

    - Filters: Status is one of "Closed Won" or "Closed Lost"

    - Group by: Status

    - Display Summaries: Add the Count field

    - Chart: Pie, select Count for the Data Series.

    This will show you the percentage of Won and Lost opportunities out of the total closed.


    For the Average Deal Size, if you want those values only for the Closed Won deals and assuming you use the "Likely" field for the amount, you can edit the previous report, go to Display Summaries and add "AVG: Likely". Click save and run.

    Under the chart, you would then see something like the following:

    The AVG: Likely for Closed Lost opportunities is 0 because the system sets the Likely to 0 when the Opportunity is Lost. If you want to also see the AVG size for closed deals, you would need to do as above but with "AVG: Lost" and this would be the result:

    If you want to show the Average Deal Size in general for all Opportunities, you would need to show it in another report.

    Last, for the Average Sales Cycle, assuming you take the Expected Closed Date as the date the deal was either closed won / lost and that you are only interested on closed records, you would need the following (proceed first in a sandbox):

    • Create a new integer field in Opportunities, make it calculated with the following formula: 

    abs(subtract(daysUntil($date_entered),daysUntil($closed_date)))

    • Add the field to the filters in Opportunities list view and filter all closed won/lost opportunities with empty value for the new field.
    • Recalculate Values for all the records found so they get the new field calculated with the number of days between date creation and expected closed date.

    Now you can edit the Win Rate report, navigate to Display Summaries and add "AVG: <new field name>

    On my demo environment, I named the field "Sales Cycle" and this is how it looks like in my report, under the chart:

    I hope this helps but let me know should you have additional questions.

    Best,

    Francesc

  • Hi Michelle, 

    Francesc did a great job explaining how to create those reports! I wanted to point out that in Sugar 14.0 and higher, we have an "Opps Closed Won v Lost by Rep" report template that also appears on the new Executive Dashboard template. This report template is very similar to the Win Rate report Francesc describes below and it could be a good starting point if you do not want to create a report from the beginning. Refer to the Report Templates documentation for more information on those. 

    I know you said you aren't ready for forecasting yet, but these reports are available with Enhanced Forecasting for Sell Premier users. Despite the name, you do not need to use the Forecasts module to use the Enhanced Forecasting Reports.These reports use stock Sugar fields to create the reports and can be further configured if needed. Let me know if you have any questions, and I'll be happy to talk more! 

    Lydia Manger

    Product Manager — Sugar Discover

  • I was on the call about the dashboards and excited to see them.  When will they be available?  I have searched in our instance and don't see them yet.  I did play with the enhanced forecasting and trying to figure out how to specify users and products.  When I deselect users it doesn't search for the users I want, it lets me type but nothing shows up.