SugarCRM 13.0 - Reports, Dashlets and Metrics

Hello,

I have a question about new reports / dashlets available in 13.0 Sugar CRM - I've attached a screenshot.

How can I create a "Customer Location" Dashlet and "Customer Revenue Over Time" report/dashlet?

Do you know what other new reports and dashlet metrics are available? I've read the upgrade documentation but could not find any information on the type of reports / graphs that are newly available.

Thank you!
Ada

Parents
  • Hi ,

    The 'Customer Location' dashlet is called the 'Maps' dashlet in the list of dashlets to add to a focus drawer or intelligence pane. This dashlet will only be available if you are running Sugar Sell Premier which comes with the Sugar Maps feature. 

    Regarding the 'over time' dashlets in the screenshot, these are dashlets you can achieve by creating a report that groups the data over the desired time intervals (e.g. 'Closed Won' opportunities aggregated by fiscal year) in combination with the 'Report Dashlet' dashlet. When adding the 'Report Dashlet' to a focus drawer or intelligence pane, you have the option to limit the report results to the record in focus so it gives you contextual analytics. 

    Chris

  • Got it & got it - thank you. 

    I went ahead and tried to create the Revenue Over Time report, but I am struggling with adding it to the dashboard in a Line Graph type dalshet form - I am getting an error saying Warning: Line Chart is not compatible with this report". 

    Is this restricted to report types or certain fields? I created Summation with Details report, I added 1 filter (Probability Equals 100, Group by Fiscal Year: Signature Date, and added New ARR (our custom field) as a summary. I am not sure what I am doing wrong?

    Thanks,

    Ada

  • Hi ,

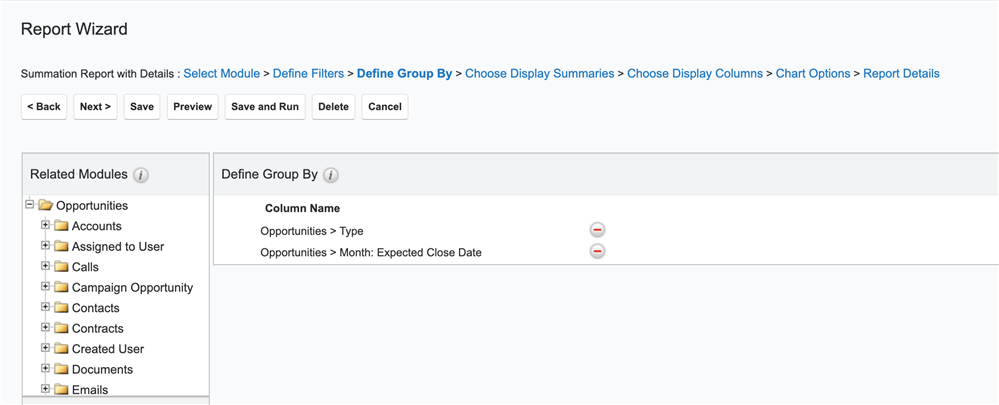
    In order to use a line graph type, you need to have at least 2 different group by fields. In my sample report, I used the Opportunities > Type and Opportunities > Month: Expected Close Date (the first group by field is used to graph the separate lines and the second group by field is what will be the X-axis of your line graph):

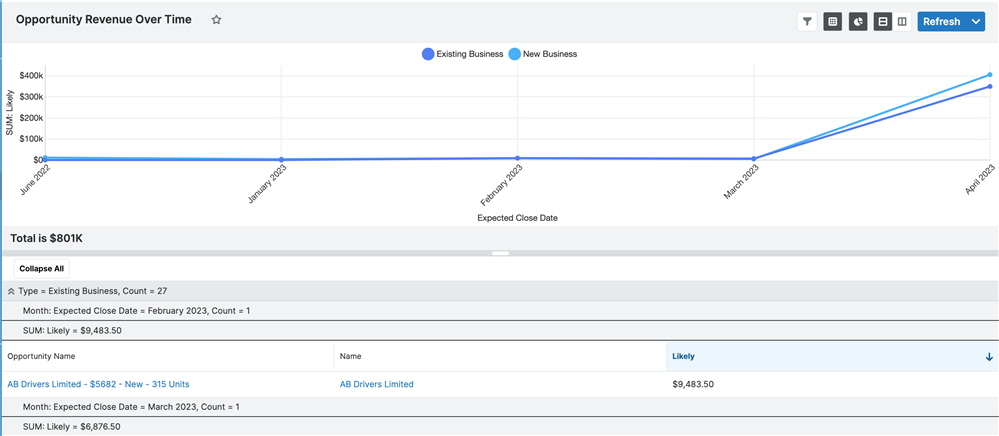
    That then was able to generate the following line graph:

    A good rule of thumb is that if you cannot select the desired chart format when creating the report, then you won't be able to use that chart format in the report dashlet either. 

    Chris

Reply Children