
Good day,
I recently upgrade to 12.3 and now my dashboard graphs do not display how I would like them too. In 12.1, I used the chart "vertical bar group" option and it would show my wins and losses as a solid bar with the total at the top of each column.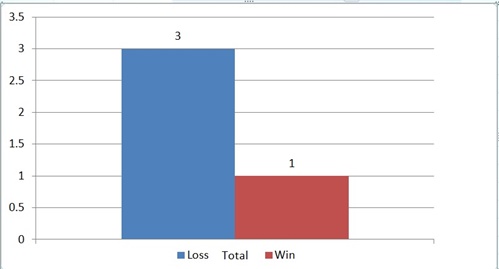
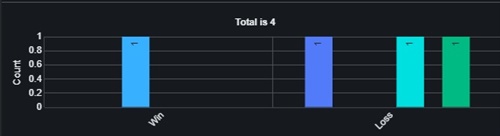
Now with 12.3 when I use the vertical bar group option it breaks my win and losses out by customer. (I am using the same report for 12.1 and 12.3) In my example below each customer has its own column, so instead of having 2 columns one for wins and another for losses, I now have 4, one for wins and 3 for losses.
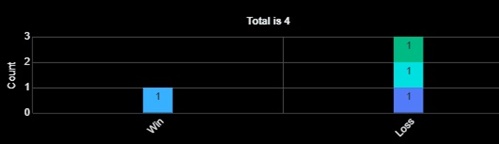
If I use the vertical bar stacked option it gets me close to displaying the graph the way I want it too. But, the column is now divided by the customer and shows the win or loss count for each customer instead of the total wins or losses.
Does anyone know a way to layout the data in the report or format the vertical bar chart options to get the graph to display the data the way it used to show in 12.1?
