Hi
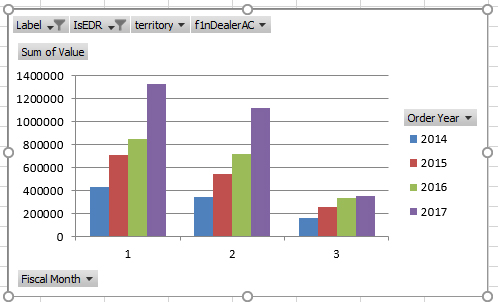
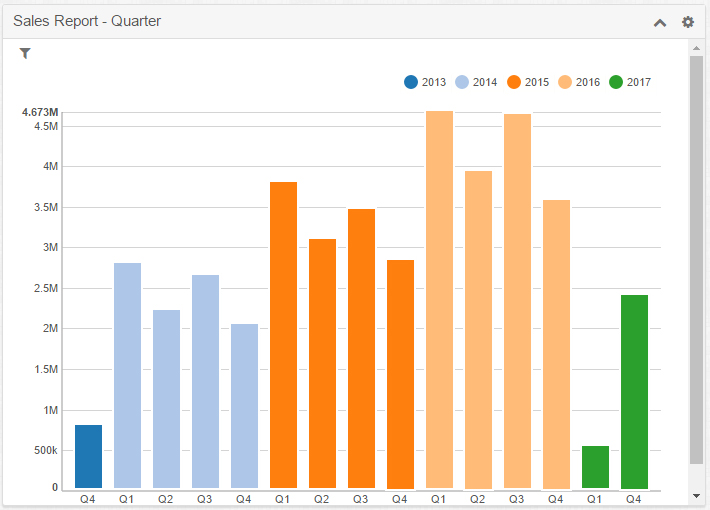
Does anyone know how I can get graphs to mimic excel in this one the Quarters are group
Excel Example
SugarCRM Example
In SugarCRM I group by Quarter/Year and get this if I do Year/Quarter I get a stacked bar chart.
Is there any way with or without a plugin I can recreate the top image??
Any help much appreciated.


