Hi, I have a question. I would like to make a cumulative sales won chart as a report in the picture below.
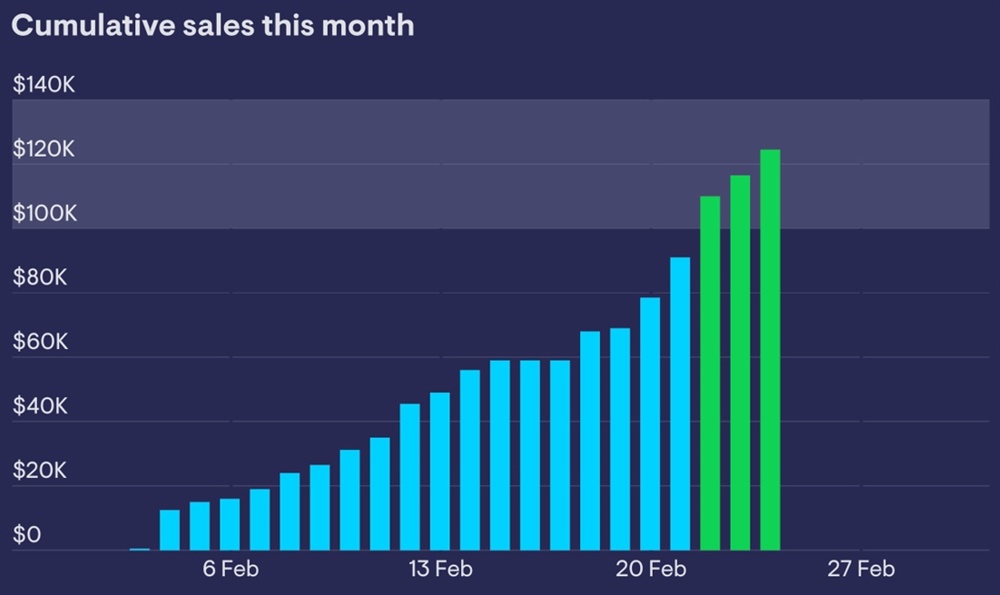
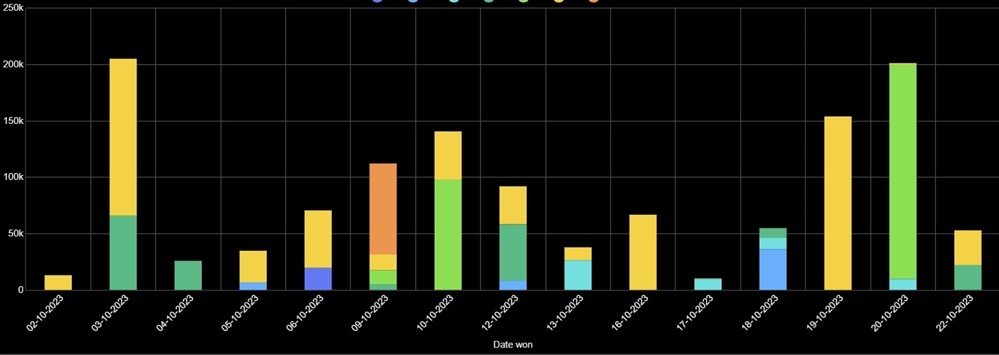
I configured a report, and for the moment it is possible to have the sales won numbers soreted out day by day on the day that the opportunity is closed. But the sales won numbers are not cumulative like in the chart above. Does anybody know how to make cumulative charts in Sugar?