Custom components don't work on mobile build iOS/Android

Hi all,

We are having some difficulties with our mobile application while running iOS and Android builds.


Our current implementation involves 4 custom made components: Calendar, Near me, Saved Near me search, Check out.


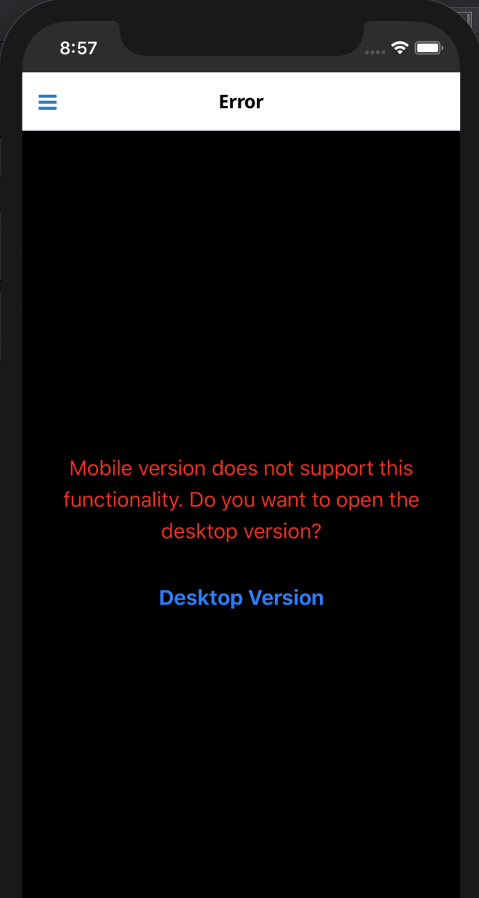
When we run the dev server in browser they are loaded and usable without any issues, but when we build our iOS or Android application, they are simply not loaded and we don’t see any error message nor warning, just the notification inside of the page, that we should open browser in order to use this module.


We have been developing most of our application on Sugar Mobile SDK v16, and now with the upgrade of v17 & v18 we have these problems.

My questions are mostly related to debugging this type of an error. How to debug it in the most convenient way because JS console doesn't throw any error, build doesn't throw any error and Android studio/XCode don't show any specific error during runtime?

Parents
  • Hi!

    The best way to debug the issue on device (Android in this case) is:

    1. build your app with debug scheme (./sdk build -s debug -p android --init-native)

    2. install app on your device connected via usb or emulator

    3. open chrome and navigate to chrome://inspect/#devices

    4. you will be able to connect to WebView using standart chrome dev tools and debug your issue

    Hope this helps and best regards

Reply
  • Hi!

    The best way to debug the issue on device (Android in this case) is:

    1. build your app with debug scheme (./sdk build -s debug -p android --init-native)

    2. install app on your device connected via usb or emulator

    3. open chrome and navigate to chrome://inspect/#devices

    4. you will be able to connect to WebView using standart chrome dev tools and debug your issue

    Hope this helps and best regards

Children
  • Hi Eugene Bychkov, thx you for that, but i already know how to handle debugging in that way. I am asking this question because i don't get any errors or unusual behavior while debugging it in that way.

    To recap, debugging in browser with local server doesn't help because all the components work in that way, while debugging on the emulator/device with chrome/safari dev tools doesn't help also as there are no warnings/errors nor something else to inform me why are those components failing to load. So it probably not a js/webview/cordova specific error its something else which i still didn't figured out.