Adding amount count to legends (pie charts)

Hi Sugarclub,

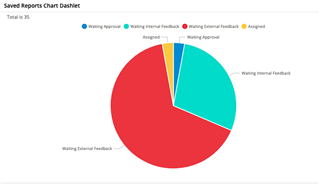
Im wondering if it's possible to easily display the number count of the statuses to a pie chart? 

For clarification, if there is 1 assigned case i would like it display e.g. "Assigned (1)" in the legend above. 


Best regards,

Pontus

Parents
  • You can customize this just for saved-reports-chart dashlet.

    The dashlet code is in clients/base/views/saved-reports-chart/saved-reports-chart.js, so you'll have to extend it in the custom folder.

    The function that we're looking at extending is 

    getSavedReportById: function(reportId, options) {

    Here, you'll see that the server returned results, and the raw chart data is set inside the function, like:

    this.reportData.set('rawChartData', serverData.chartData);

    Now, all you have to do is to tweak this serverData.chartData, which looks something like:

    Data Structure of Chart Data

    Now all we have to do is to update the chartData.values, with something like:

    _.each(serverData.chartData.values, function(dataRow)  {
    _.each(dataRow.label, function(label, index) {
    dataRow.label[index] += " - " + dataRow.valuelabels[0];
    });
    });

    This will ensure that the labels will also display the values along with it.

    Just be sure to restrict it to certain reports or chart types, otherwise, it can quickly get messy-looking :)

Reply
  • You can customize this just for saved-reports-chart dashlet.

    The dashlet code is in clients/base/views/saved-reports-chart/saved-reports-chart.js, so you'll have to extend it in the custom folder.

    The function that we're looking at extending is 

    getSavedReportById: function(reportId, options) {

    Here, you'll see that the server returned results, and the raw chart data is set inside the function, like:

    this.reportData.set('rawChartData', serverData.chartData);

    Now, all you have to do is to tweak this serverData.chartData, which looks something like:

    Data Structure of Chart Data

    Now all we have to do is to update the chartData.values, with something like:

    _.each(serverData.chartData.values, function(dataRow)  {
    _.each(dataRow.label, function(label, index) {
    dataRow.label[index] += " - " + dataRow.valuelabels[0];
    });
    });

    This will ensure that the labels will also display the values along with it.

    Just be sure to restrict it to certain reports or chart types, otherwise, it can quickly get messy-looking :)

Children