Hello,
With the new Cloud Insights feature built into the Admin of On-Demand instances is there any way to retrieve instance storage via an API request?
Hello,
With the new Cloud Insights feature built into the Admin of On-Demand instances is there any way to retrieve instance storage via an API request?
Just throwing my keys in the bowl too, or hat in the ring...
Just had the same thought myself. I am intersted to log our DB and FS storage over time so I can predict the rate that we are likely to fill up.
An API call would be cool for this.
I suspect it is a different authentication to accessing your normal cloud instance though?
Insights: https://sugarcloud-insights-euw2.service.sugarcrm.com/usage
Instance: https://yourinstancename.sugaropencloud.uk/ or .eu etc..
I see it is a very old post, so hopefully get it restarted
Bazzilion thanks ;-)
HI Luke Ridgway,
From 12.2 the backups can be downloaded from the Insights URL via API.
If you follow the same authentication process and observe the endpoint of the first page: You can use it to retrieve the cloud usage per instance.
Endpoint - https://<sugar_insights_url>/api/v1/app_instance
It returns something like this.
Mind that the OAuth token needs to be from an Admin user.
Let me know if this works for you.
Hi Shad Mickelberry & Andre Serrazina,
Tagging in Alex Nassi too as we had joked about some of these 'side projects'.
Well, this one I actually got finished!
I just wanted to share my progress and maybe posting this will help anybody else do similar.
Following your advice above Andre I used postman to authenticate as per usual via the rest api, then use the token to get the data from the Insights api: Endpoint - https://<sugar_insights_url>/api/v1/app_instance
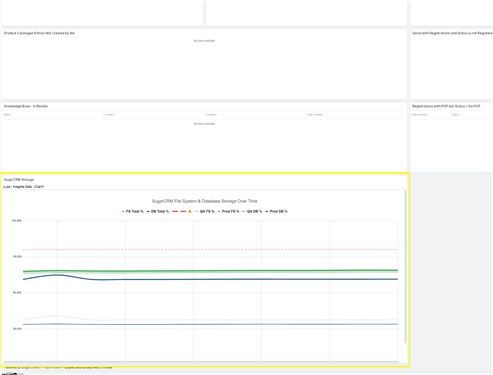
Fast forward to a couple of days ago and too many late nights, and probably too much work time, I now have this:
All that means I now have a chart on my dashboard showing insights database and file system storage logged over time. I will keep an eye this to see when I need to pull my finger out and start culling old records / big files etc.. (which is the next phase of this project, maybe data archiver).
I am happy to share the code from Apps Script if anybody is interested. It may not be the best code in the world, my first ever javascript attempt so no warranties are available... sold as seen, no refunds and all knowledge will be denied.
I hope there was not an easier way to accomplish this...
...if you know of a such a way - please keep it to yourself.
And here it is in all it's glory...
Ok, I know it its just a bunch of flat lines, but over time... it will become awesome

WOW Luke Ridgway,
This is actually awesome ;),
Thanks for sharing and I am really happy that I helped you initiate this project.
*Sorry for the late nights though.
Happy monitoring!!
Hello folks - FYI I expanded this information in the post linked below:
Getting Sugar Data into Google Sheets with Google Apps Script