Hi sugar developers,
Thanks for looking on my issues I am facing.
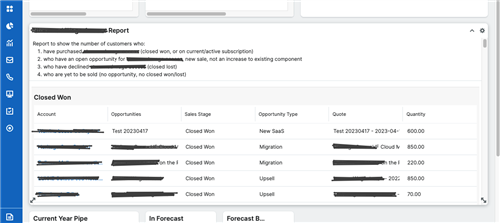
I have created custom dashlet. I can able to get data from API query and then show it to dashlet in table format. which works fine.
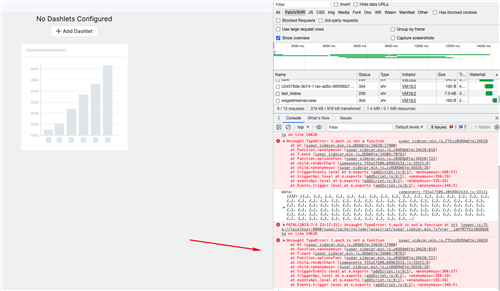
But now I want to show same thing in Bar/multibarchart ....I have written the javascript code based on sugarcrm code which uses sucrose library to generate multibarChart. code is as below and the error I am getting.
Please help me find the issue or direction to make sucrose.charts.multibarChart() work on custom dashlet.
/**
 * @class View.Views.Base.CustomerJourneyDashletView
 * @alias SUGAR.App.view.views.BaseCustomerJourneyDashletView
 * @extends View.View
 */
({
	plugins: ['Dashlet', 'Chart'],
	css: ["custom/include/css/wage-stream-access.css"],
	wages: undefined,
	wagesByCategory: {},

	_groupWagesByCategory: function(wages) {
		const wagesByCategory = {};
		wages.forEach(wage => {
			const category = wage.category || 'Other';
			if (!wagesByCategory[category]) {
				wagesByCategory[category] = [];
			}
			wagesByCategory[category].push(wage);
		});
		return wagesByCategory;
	},

	_countWagesByCategory: function(wagesByCategory) {
		const categoryCounts = {};
		for (const category in wagesByCategory) {
			categoryCounts[category] = wagesByCategory[category].length;
		}
		return categoryCounts;
	},

	_retrieveData: function() {
		var cntrlr = this;
		app.api.call('GET', app.api.buildURL('wagestreamaccess'), null, {
			success: function(data) {
				console.log("data: ", data);
				if (data.length > 0) {
					cntrlr.wages = cntrlr._groupWagesByCategory(data);
					cntrlr.categoryCounts = cntrlr._countWagesByCategory(cntrlr.wages);
					_.extend(cntrlr, cntrlr.wages);
					cntrlr.render();
					cntrlr.renderChart();
				}
			},

			error: function(e) {
				throw e;
			}
		});
	},

	renderChart: function() {
		if (this.wages) {
			const chartData = [];
			for (const category in this.categoryCounts) {
				chartData.push({
					name: category,
					value: this.categoryCounts[category]
				});
			}
			const chartOptions = {
				height: 300,
				margin: { top: 20, right: 20, bottom: 50, left: 50 },
				x: function(d) { return d.name; },
				y: function(d) { return d.value; },
				xAxis: {
					axisLabel: 'Category'
				},
				yAxis: {
					axisLabel: 'Count',
					axisLabelDistance: -10
				}
			};

			this.chart = sucrose.charts.multibarChart()
				.options(chartOptions)
				.data(chartData)
				.selector('#chart-container')
				.render();
		}
	},

	initialize: function(options) {
		this.wages = [];
		this.categoryCounts = {};
		this._super('initialize', [options]);
		this._retrieveData();
	}
})
<div class="control-group dashlet-options">
    <div class="controls controls-two btn-group-fit">
        <div class="row-fluid">
            <div class="">
                <p>Report to show the number of customers who:</p>
                <ol>
                    <li>have purchased streamed wage access (closed won, or on current/active subscription)</li>
                    <li>who have an open opportunity for streamed wage access, new sale, not an increase to existing component</li>
                    <li>who have declined streamed wage access (closed lost)</li>
                    <li>who are yet to be sold (no opportunity, no closed won/lost)</li>
                </ol>
            </div>
        </div>
    </div>
</div>
<div id="chart-container"></div>
<?php

/**
 * Metadata for the wage-stream-access dashlet view
 */
$viewdefs['base']['view']['wage-stream-access'] = array(
    'dashlets' => array(
        array(
            'label' => 'Streamed Wage Access Report',
            'description' => 'Lists Streamed Wage Access report',
            'config' => array(),
            'preview' => array(),
            'filter' => array(
                'module' => array(
                    'Home',
                    'Accounts',
                    'Leads',
                ),
                'view' => array(
                    'record',
                )
            )
        ),
    ),
);
working custom dashlet screenshot with table